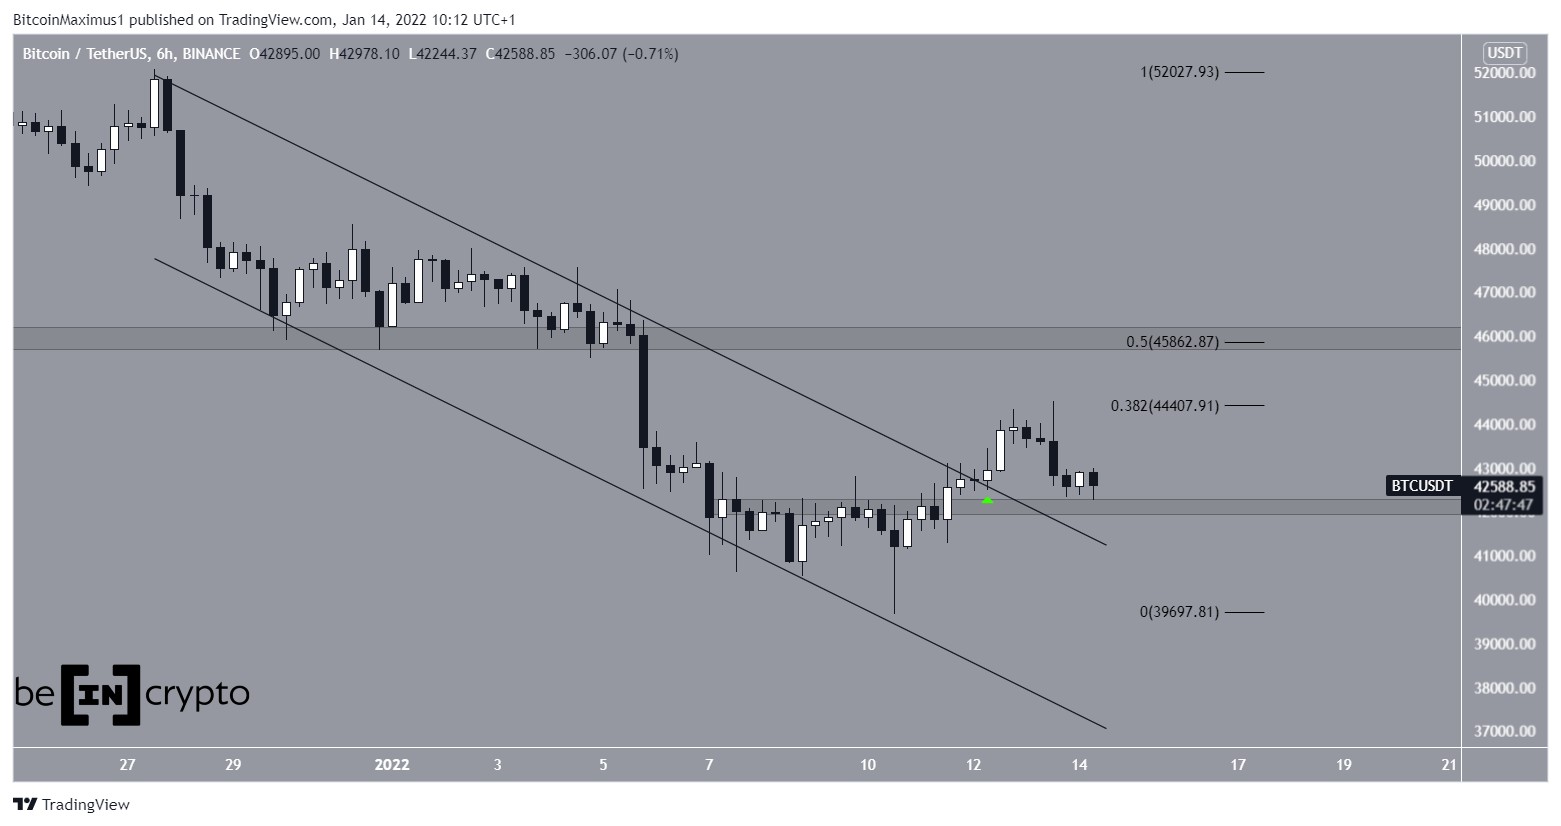
Bitcoin (BTC) was rejected by the $44,200 resistance area on Jan 13 and is currently trying to find support.
On Jan 12, BTC broke out from a descending parallel channel that had previously been in place since Dec 27. This was a sign that the correction had come to an end.
It continued to increase until it reached a high of $44,500 on Jan 13. The high was made right at the 0.382 Fib retracement resistance level when measuring the previous downward movement.
While there was stronger resistance at $45,800, BTC failed to reach it.

After the rejection, BTC dropped and has now returned to the $42,100 area, which previously acted as resistance. The area is now expected to act as support.

Būsimas BTC judėjimas
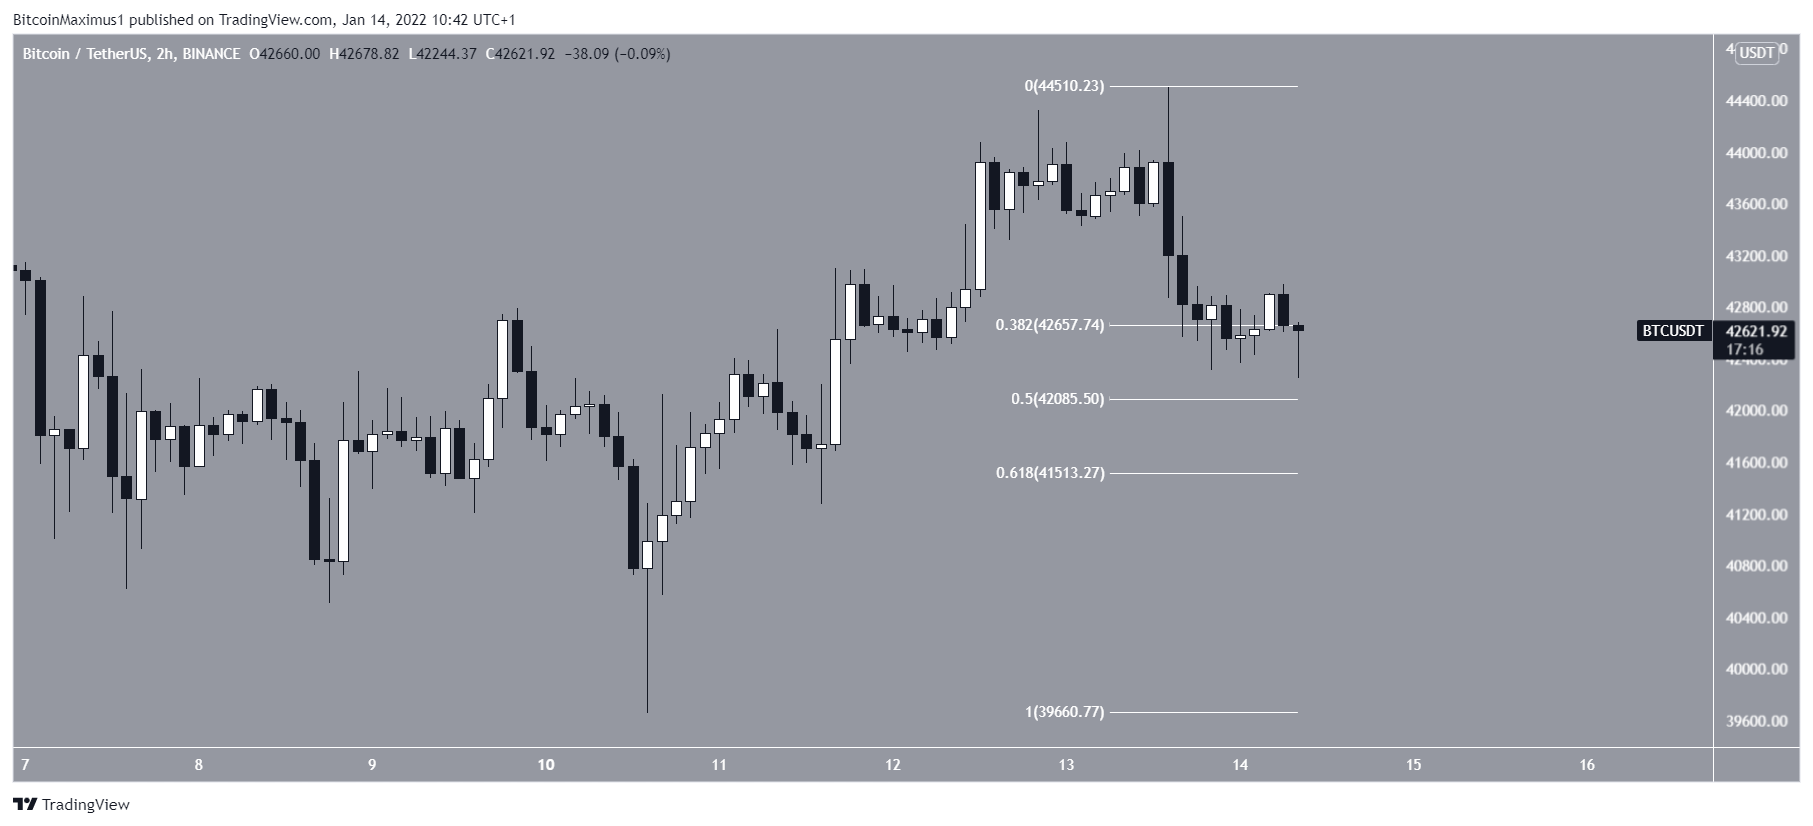
The two-hour chart shows that BTC is trading between the 0.382 – 0.5 Fib retracement support levels at $42,100 – $42,650. This is a strong support area that could initiate a bounce.
There is support all the way down to $41,500, the 0.618 Fib retracement support level, which is also a horizontal support area.

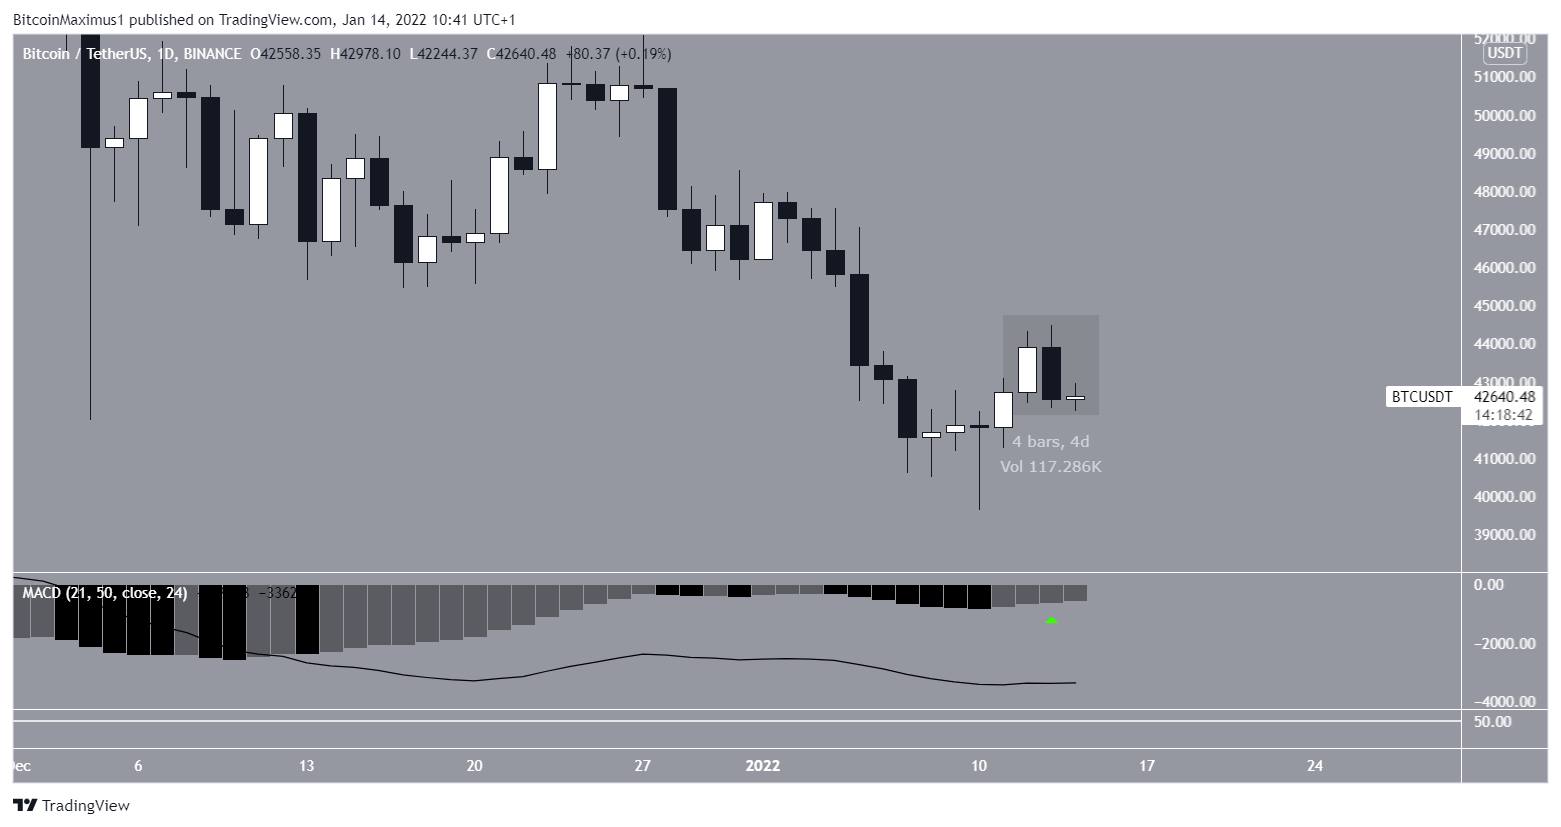
However, the daily chart provides mixed signals. While the MACD has generated successive higher momentum bars, a sign of a potential reversal signal, BTC has created a bearish engulfing candlestick.
Therefore, while technical indicators are bullish, the price action is bearish, failing to provide a consensus for the direction of the trend.

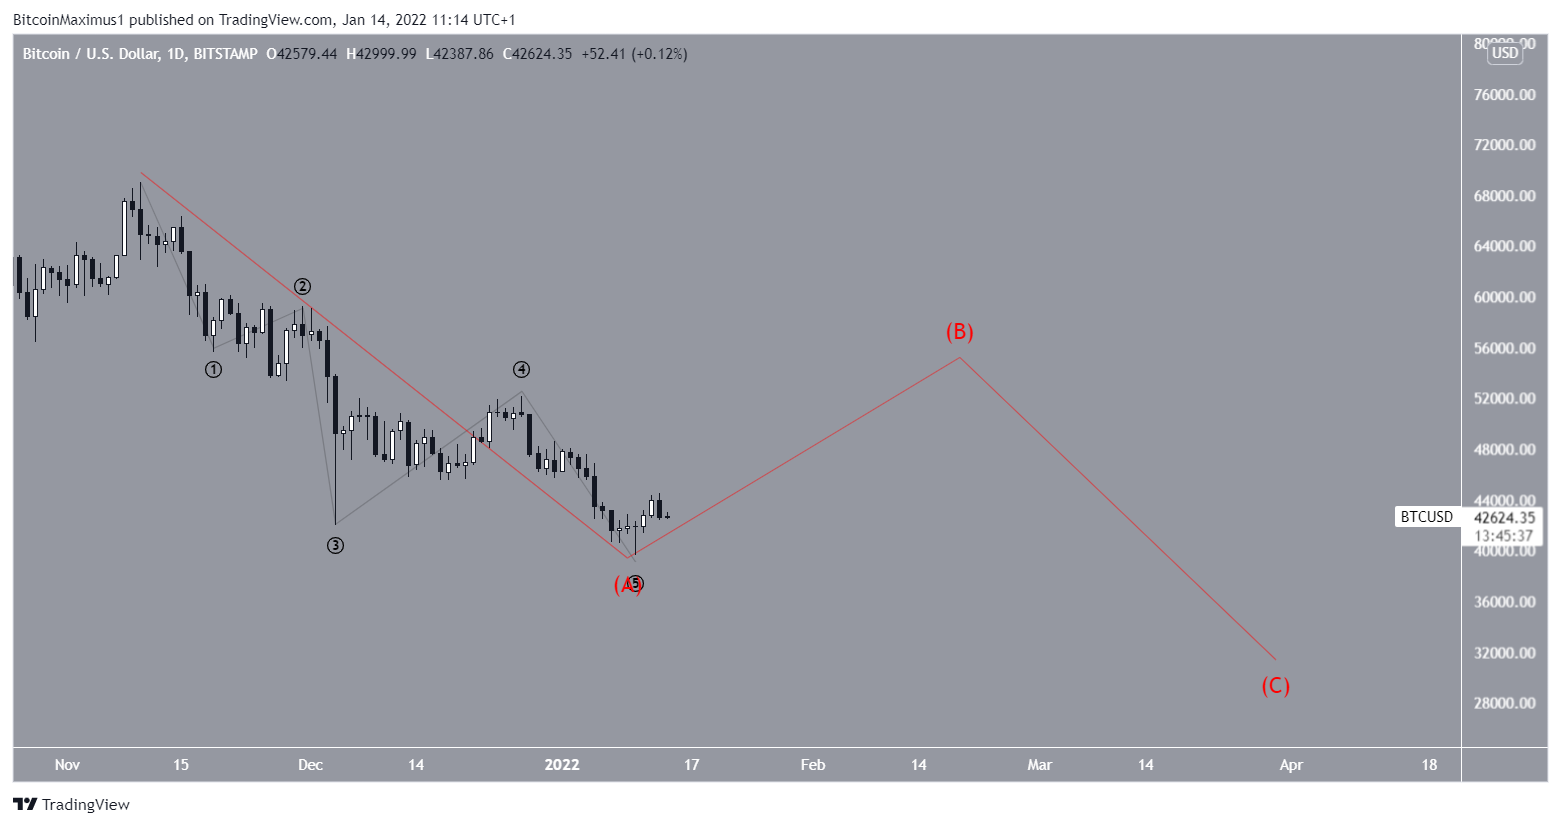
Bangų skaičius
There are two main possibilities for the long-term wave count, both of which indicate that BTC will bounce in the short-term.
The first one suggests that BTC Has been correcting inside a W-X-Y (red) corrective pattern since reaching an all-time high price of $69,000 on Nov 10. The sub-wave count is given in black.
In this possibility, the price will bounce in the short-term towards $45,000 – $48,000, completing the B sub-wave before another drop would complete the entire correction.
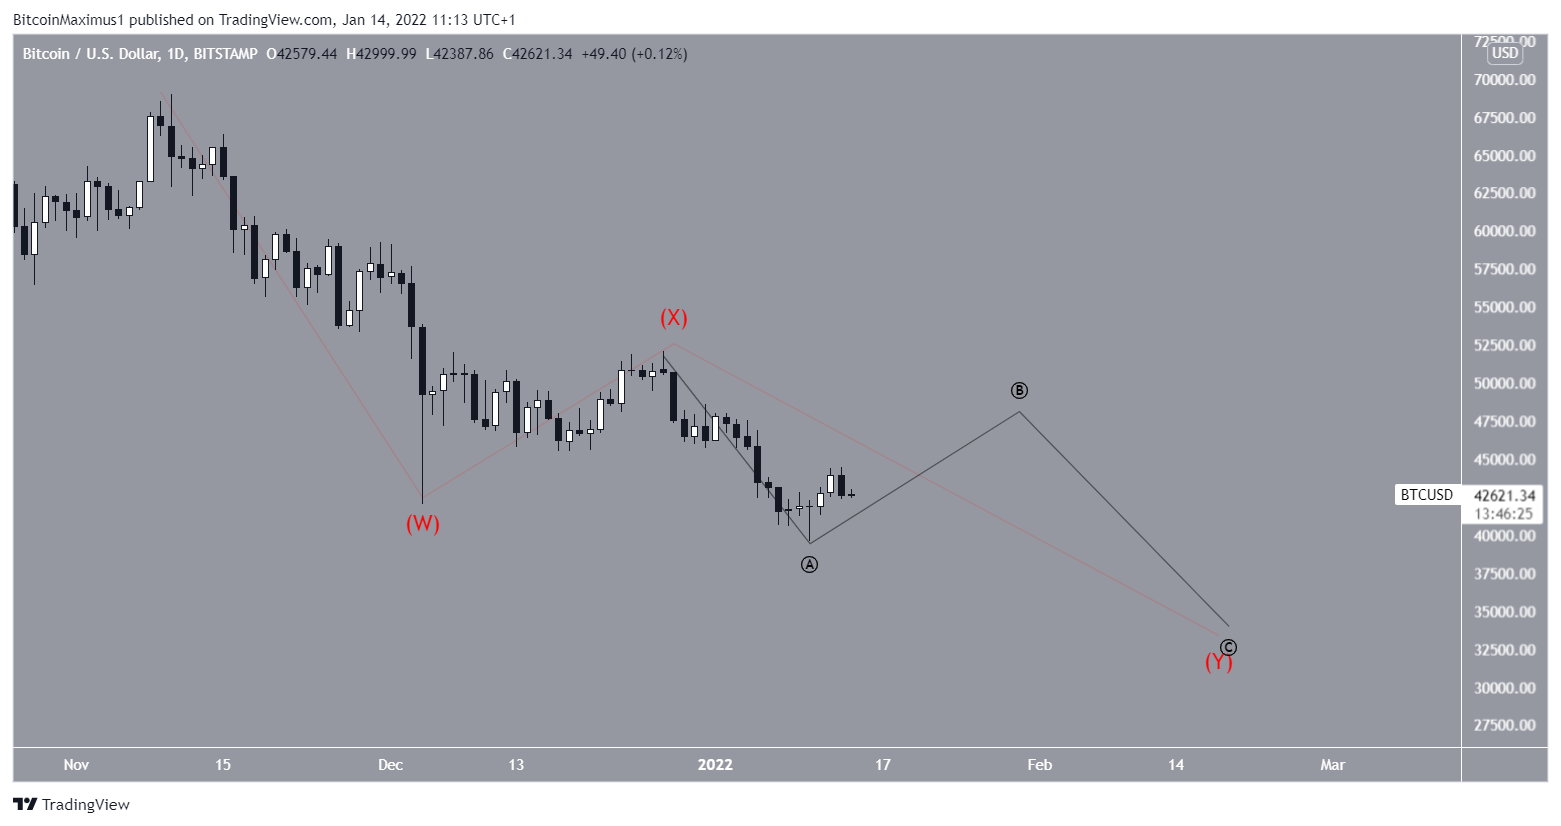
The alternate count also indicates that BTC has been correction since the all-time high price on Nov 10. However, the entire correction has taken an A-B-C structure (red), in which wave A has just been completed.
Therefore, the bounce would be more significant, potentially reaching highs near $55,000 prior to another drop.
Norėdami sužinoti ankstesnę BeInCrypto Bitcoin (BTC) analizę, spustelėkite čia.
Atsakomybės neigimas
Visa mūsų svetainėje esanti informacija skelbiama sąžiningai ir tik bendro pobūdžio informacijos tikslais. Bet kokie veiksmai, kuriuos skaitytojas imasi remdamasis mūsų svetainėje esančia informacija, yra griežtai jų pačių rizika.
Source: https://beincrypto.com/bitcoin-btc-bounces-after-rejection-from-44200-resistance/