- BTC price formed a double bottom pattern and have succeeded to breakout of neckline resistance at $18,385
- Bitcoin crypto price had sustained above 50 day EMA but it is struggling to breakout of the 200 day EMA hurdle
- BTC price is showing signs of long term base formation near $20,000
Bitcoin price is trading with mild bullish cues and bulls are attempting to break out of the 200 day EMA. According to Coingalss, $21,000 strike price holds a Call open interest at 15.27K BTC and Put at 3.97K BTC which clearly indicates the strength of buyers. Currently, The pair of BTC / USD prekiauja už 20,821.76 USD, o dienos prieaugis yra 0.71%, o 24 valandų apimties ir rinkos kapitalizacijos santykis yra 0.0745
BTC price turned bullish and formed three white shoulder modelis
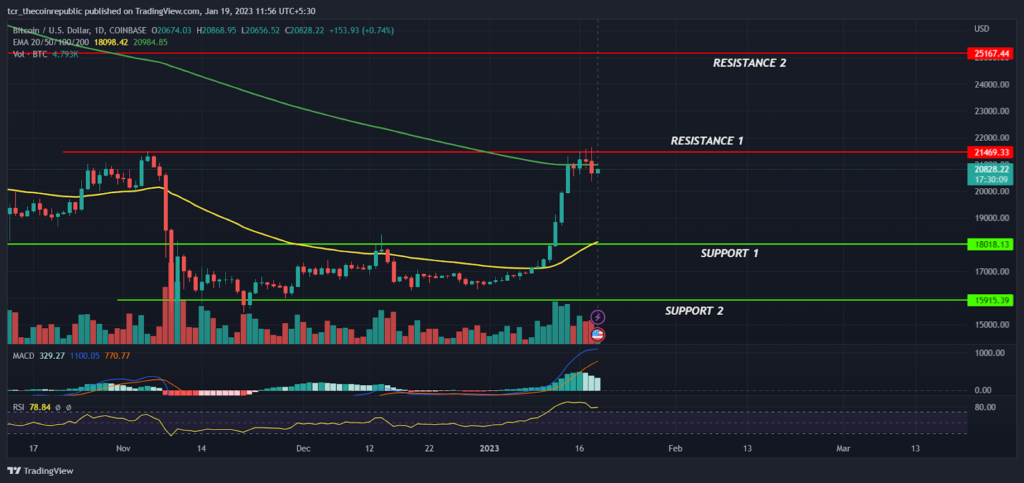
On a daily time frame, BTC price had shown a surprising rally of 3000 points in a short span of time and formed a double bottom bullish reversal pattern. From the past couple of months BTC price got stuck in the narrow range between $15,500 to $18,000 and experts have turned highly bearish and are expecting more downside in the BTC prices but market chooses the opposite direction and shot up 32% approx from the lows.
BTC price had succeeded to reclaim the 50 day EMA (yellow)which had reversed the short term trend in the favor of bulls but unfortunately the positional trend is still in the bear grip as prices struggled at the 200 day EMA(green). However, In the coming weeks, If BTC bulls will be able to break out of the 200 day EMA and $21,500 hurdle level we may see the next phase of rally in the short span of time which can take BTC to the $25,000 level

According to technical analysis, BTC prices are expected to consolidate in the range between $18,500 to $25,000 in the coming months and if any minor correction triggers from the higher level, it will provide an opportunity for investors and traders to build fresh long positions. On the lower side $18,000 and $16,000 will act as a demand zone for investors. The MACD had generated positive crossover but the curve is sloping sideways denotes prices are lacking the momentum near the supply zone and the RSI at 78 denotes the overbought level.
Santrauka
Bitcoin prices had shot up 30% from the lows and formed a three white shoulder bullish pattern which indicates the buyers dominance on the lower levels. The technical analysis suggests that BTC price may enter into the short term consolidation but eventually it will break out of upside. Therefore, traders may look for buying opportunities for the target of $25,000 and above by keeping $18,500 as SL. However if prices slipped below $18,500 bears may try to test $16,000 again.
Techniniai lygiai
Atsparumo lygiai: 21,500 USD ir 25,100 USD
Palaikymo lygiai: 18,000 USD ir 16,000 USD
Atsakomybės neigimas
Autoriaus ar bet kurių šiame straipsnyje įvardytų žmonių išsakytos pažiūros ir nuomonės yra tik informacinio pobūdžio ir nėra finansinės, investicinės ar kitos konsultacijos. Investuojant į kriptovaliutų turtą arba juo prekiaujant kyla finansinių nuostolių rizika.
Andrew yra „blockchain“ kūrėjas, kuris susidomėjo kriptovaliutomis dar baigęs studijas. Jis yra akylas detalių stebėtojas ir dalijasi savo aistra rašyti bei būti kūrėju. Jo pagrindinės žinios apie „blockchain“ padeda jam suteikti unikalią perspektyvą jo rašymui
Source: https://www.thecoinrepublic.com/2023/01/19/bitcoin-price-prediction-will-btc-price-reach-25000-mark-before-the-first-quarter-of-2023-ends/