Bitcoin price has been hovering above the fragile $19,000 support for months, but trading volume seems to be rising. This is surprising as the low nepastovumas in the crypto market does not encourage investors to make big moves.
Still, in the background of this monotony comes on-chain data. It suggests BTC tokens are vanishing from exchanges at a rate not seen since early 2020. This is creating a situation where exchange deposits have returned to the lows seen 2.5 years ago, as big players could be buying every dip. If this trend persists, it could lead to a Bitcoin supply shock, which may become the catalyst for a bullish reversal in the crypto market.
Bitcoin is vanishing from exchanges
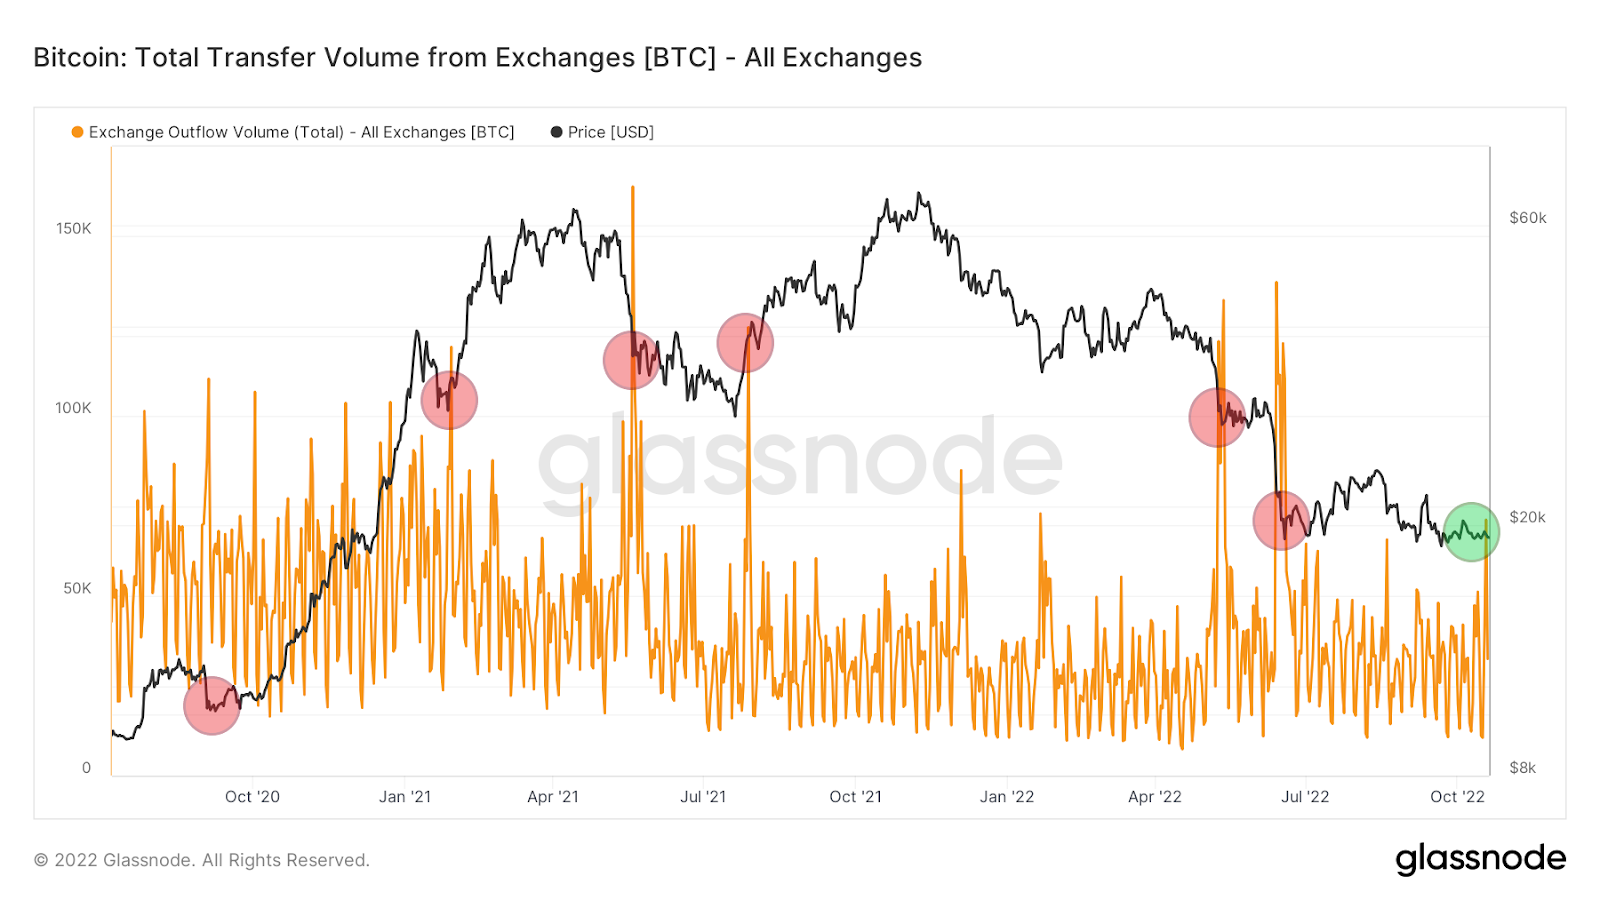
One way to measure the ratio between the demand and supply of Bitcoin is the Exchange Netflow Volume indicator. It expresses the difference in volume flowing into and out of exchanges, i.e. the net flow of coins into/out of exchanges.
High, green values of this indicator usually appear at the end of a bull market and/or are a signal of impending declines. Low, red values often appear near the bottom of a bear market, signaling the possibility of increases. The greater the deviation of the indicator from zero, the greater the supply imbalance of Bitcoin on the exchanges. This could be a catalyst for high volatility in the BTC price.

The 14-day moving average of Exchange Netflow Volume has just reached values not seen since the March 2020 crash. This means that the difference between the inflow and outflow of coins on the exchanges is reaching extreme values.
The last time we saw such low values of the indicator was during the following periods (blue areas):
- strong V-shape recovery of the BTC price after the crash in March 2020,
- the beginning of the late 2020 bull market, when Bitcoin was heading to break through the historic 2017 ATH of $20,000,
- the bounce of the BTC price after the summer 2021 bottom at $29,000 and the beginning of the rally toward the current ATH of $69,000,
- the end of the June 2022 decline and the current BTC price bottom at $17,600.

Are institutional investors buying the BTC dip?
The above data points to an impending BTC supply shock, which could become the catalyst for a bullish reversal in the crypto market. This shock will not be triggered solely by dideli nutekėjimai from exchanges. They have increased recently (green), but remain well below the values from BTC’s biggest lows of the last 2 years (red).
The high values of the Exchange Netflow Volume indicator are currently the result of large outflows and extremely low BTC inflows to the exchanges. In the chart below, we can see that Bitcoin’s inflows to exchanges today are in a strong downtrend (green). In most other cases, inflows during periods of price bottoms were as large as outflows (red and orange).

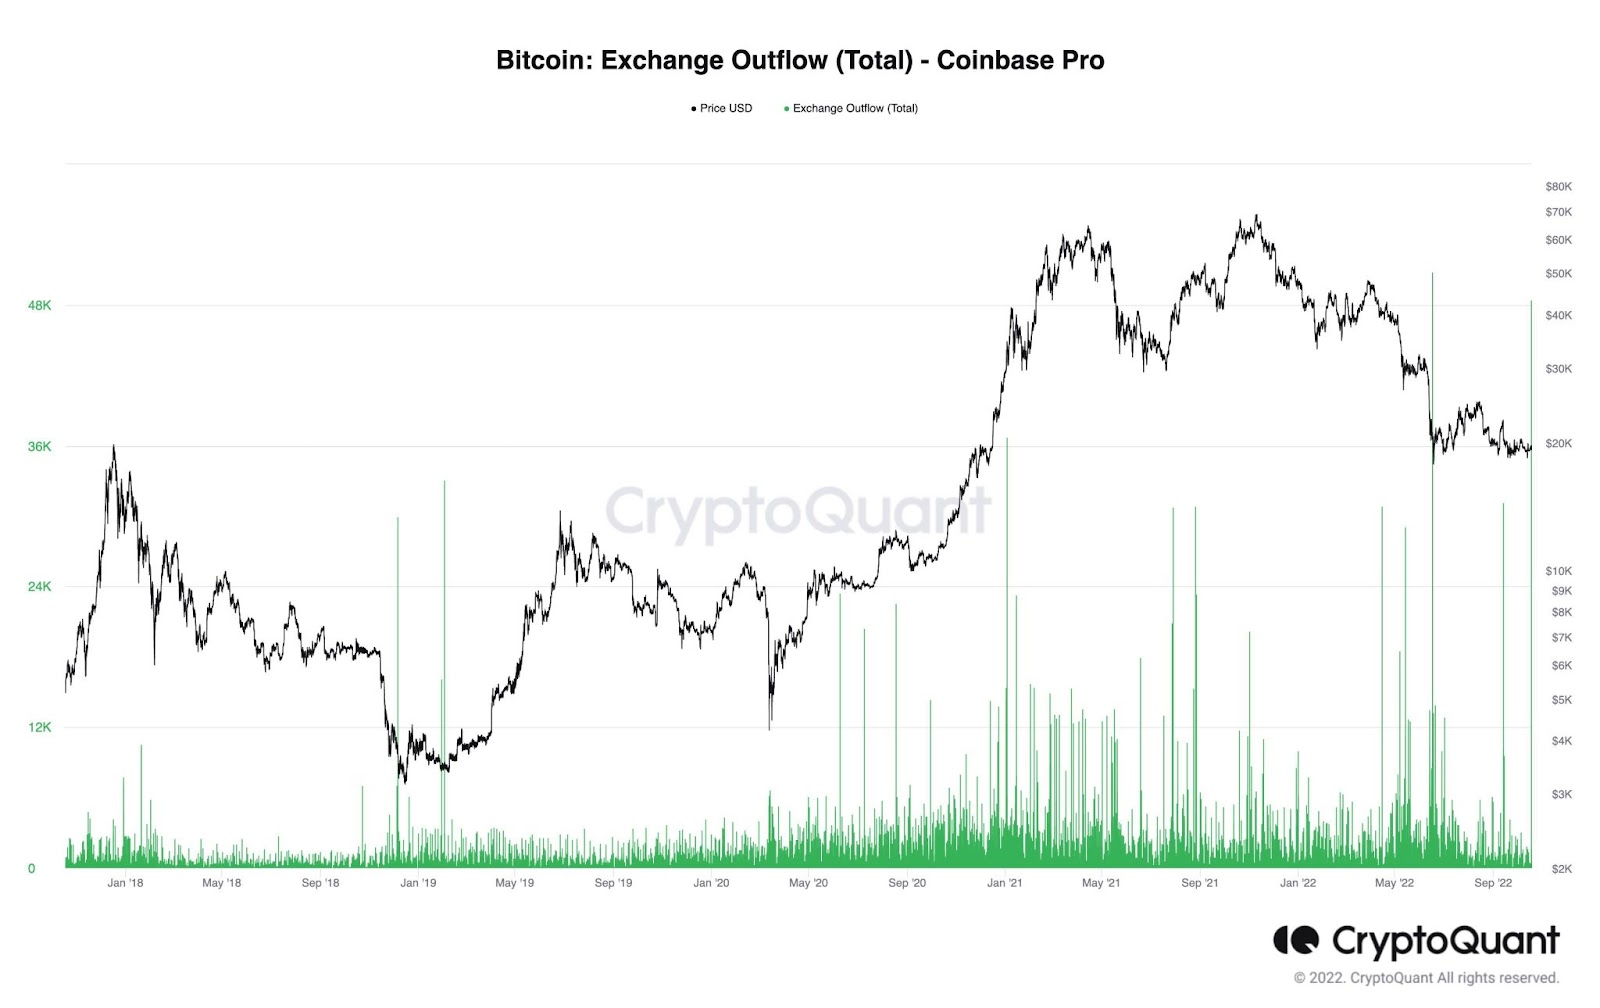
In contrast, outflows from exchanges may be correlated with purchases by institutional investors. A good clue to this argument is a chart of outflows from Coinbase Pro, an exchange considered a gateway to the crypto market for United States institutions.
On the daily chart of outflows from Coinbase Pro, we see that institutional “smart money” tended to buy at the bottom. Comparing Coinbase outflow volume with the previous bear market bottom of 2018-19, we also see two highs on the chart. These were correlated with the two BTC price lows near $3500. Shortly thereafter, increases followed.
Exchange deposits reach 2.5-year low
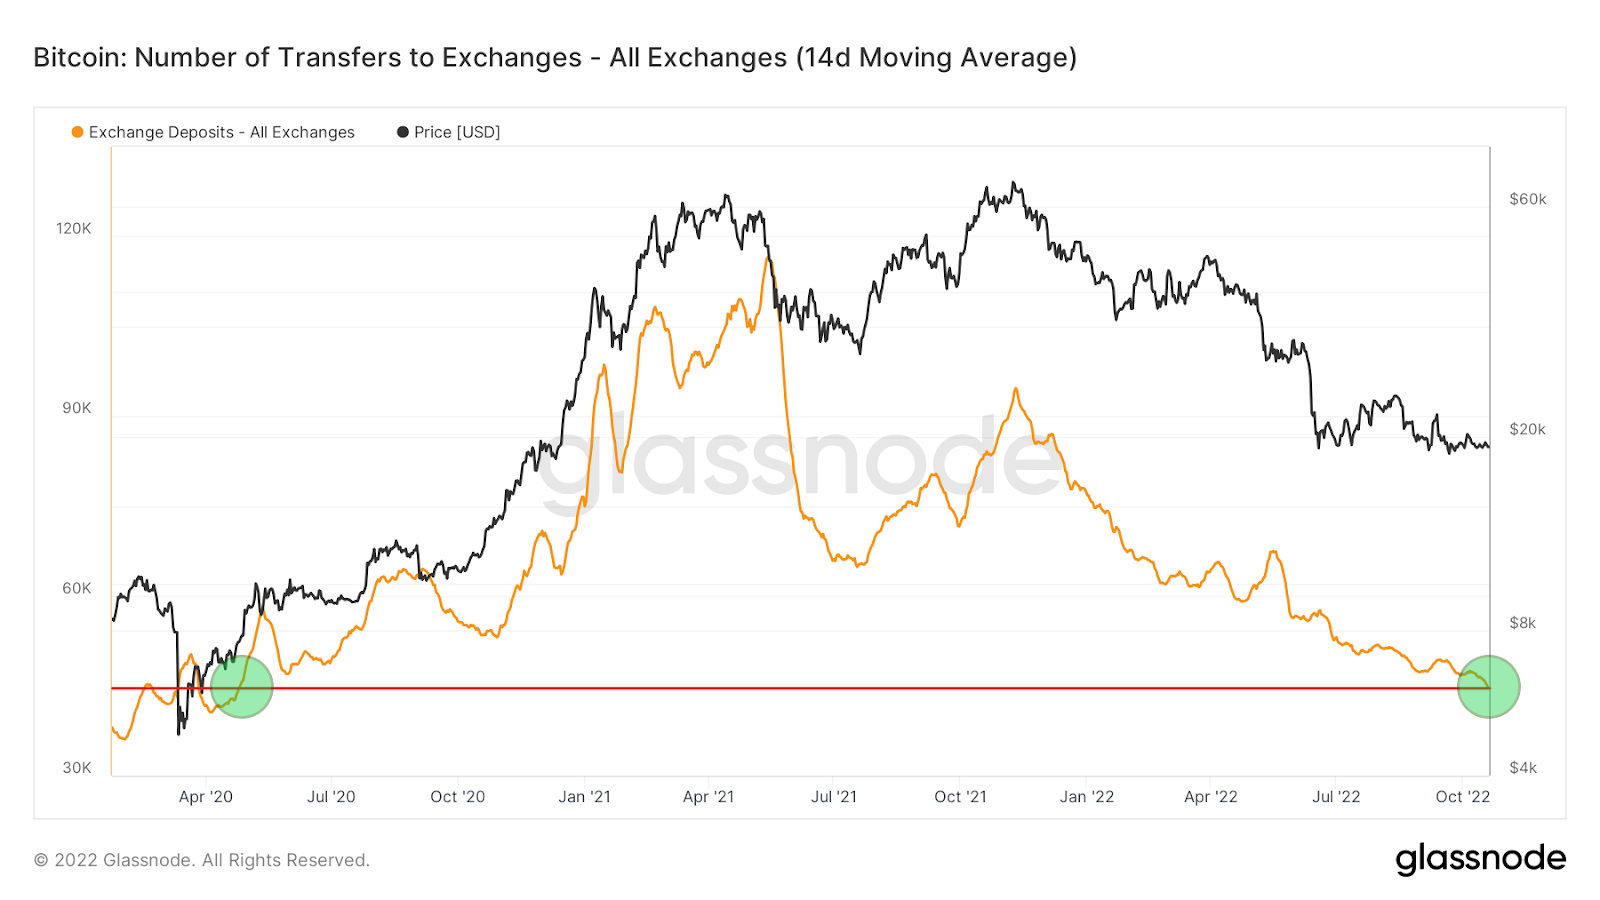
Confluence with the above on-chain data is another indicator of Exchange Deposits. Similar to the exchange inflows indicator, it measures the total number of transfers to exchange addresses, i.e. the number of on-chain deposits to exchanges.
Historically, Exchange Deposits are usually positively correlated with the price of BTC. This means that if the number of deposits to exchanges increases, the price of Bitcoin rises. Conversely, when the number of deposits decreases, the price of BTC also falls.
Currently, Exchange Deposits have reached a 2.5-year low, since similarly low values last appeared in April 2020. At that time, the price of BTC was around $7,500 and was recovering from the March 2020 crash. Although the downward trend in the number of deposits does not yet show signs of reversal, the low level of this indicator may indicate the end of the crypto bear market.
Norėdami atlikti naujausią „BeInCrypto“ Bitcoin (BTC) analizę, paspauskite čia.
Atsakomybės neigimas
Visa mūsų svetainėje esanti informacija skelbiama sąžiningai ir tik bendro pobūdžio informacijos tikslais. Bet kokie veiksmai, kuriuos skaitytojas imasi remdamasis mūsų svetainėje esančia informacija, yra griežtai jų pačių rizika.
Source: https://beincrypto.com/bitcoin-vanishes-from-exchanges-fastest-rate-since-march-2020/