The market has been suffering through extremely low volatility and a lack of demand as fear seems to be the predominant sentiment. Bitcoin’s price appears to have entered a mid-term consolidation stage between $15K and $17K, and a breakout from either direction should determine the cryptocurrency’s direction.
Techninė analizė
By shayan
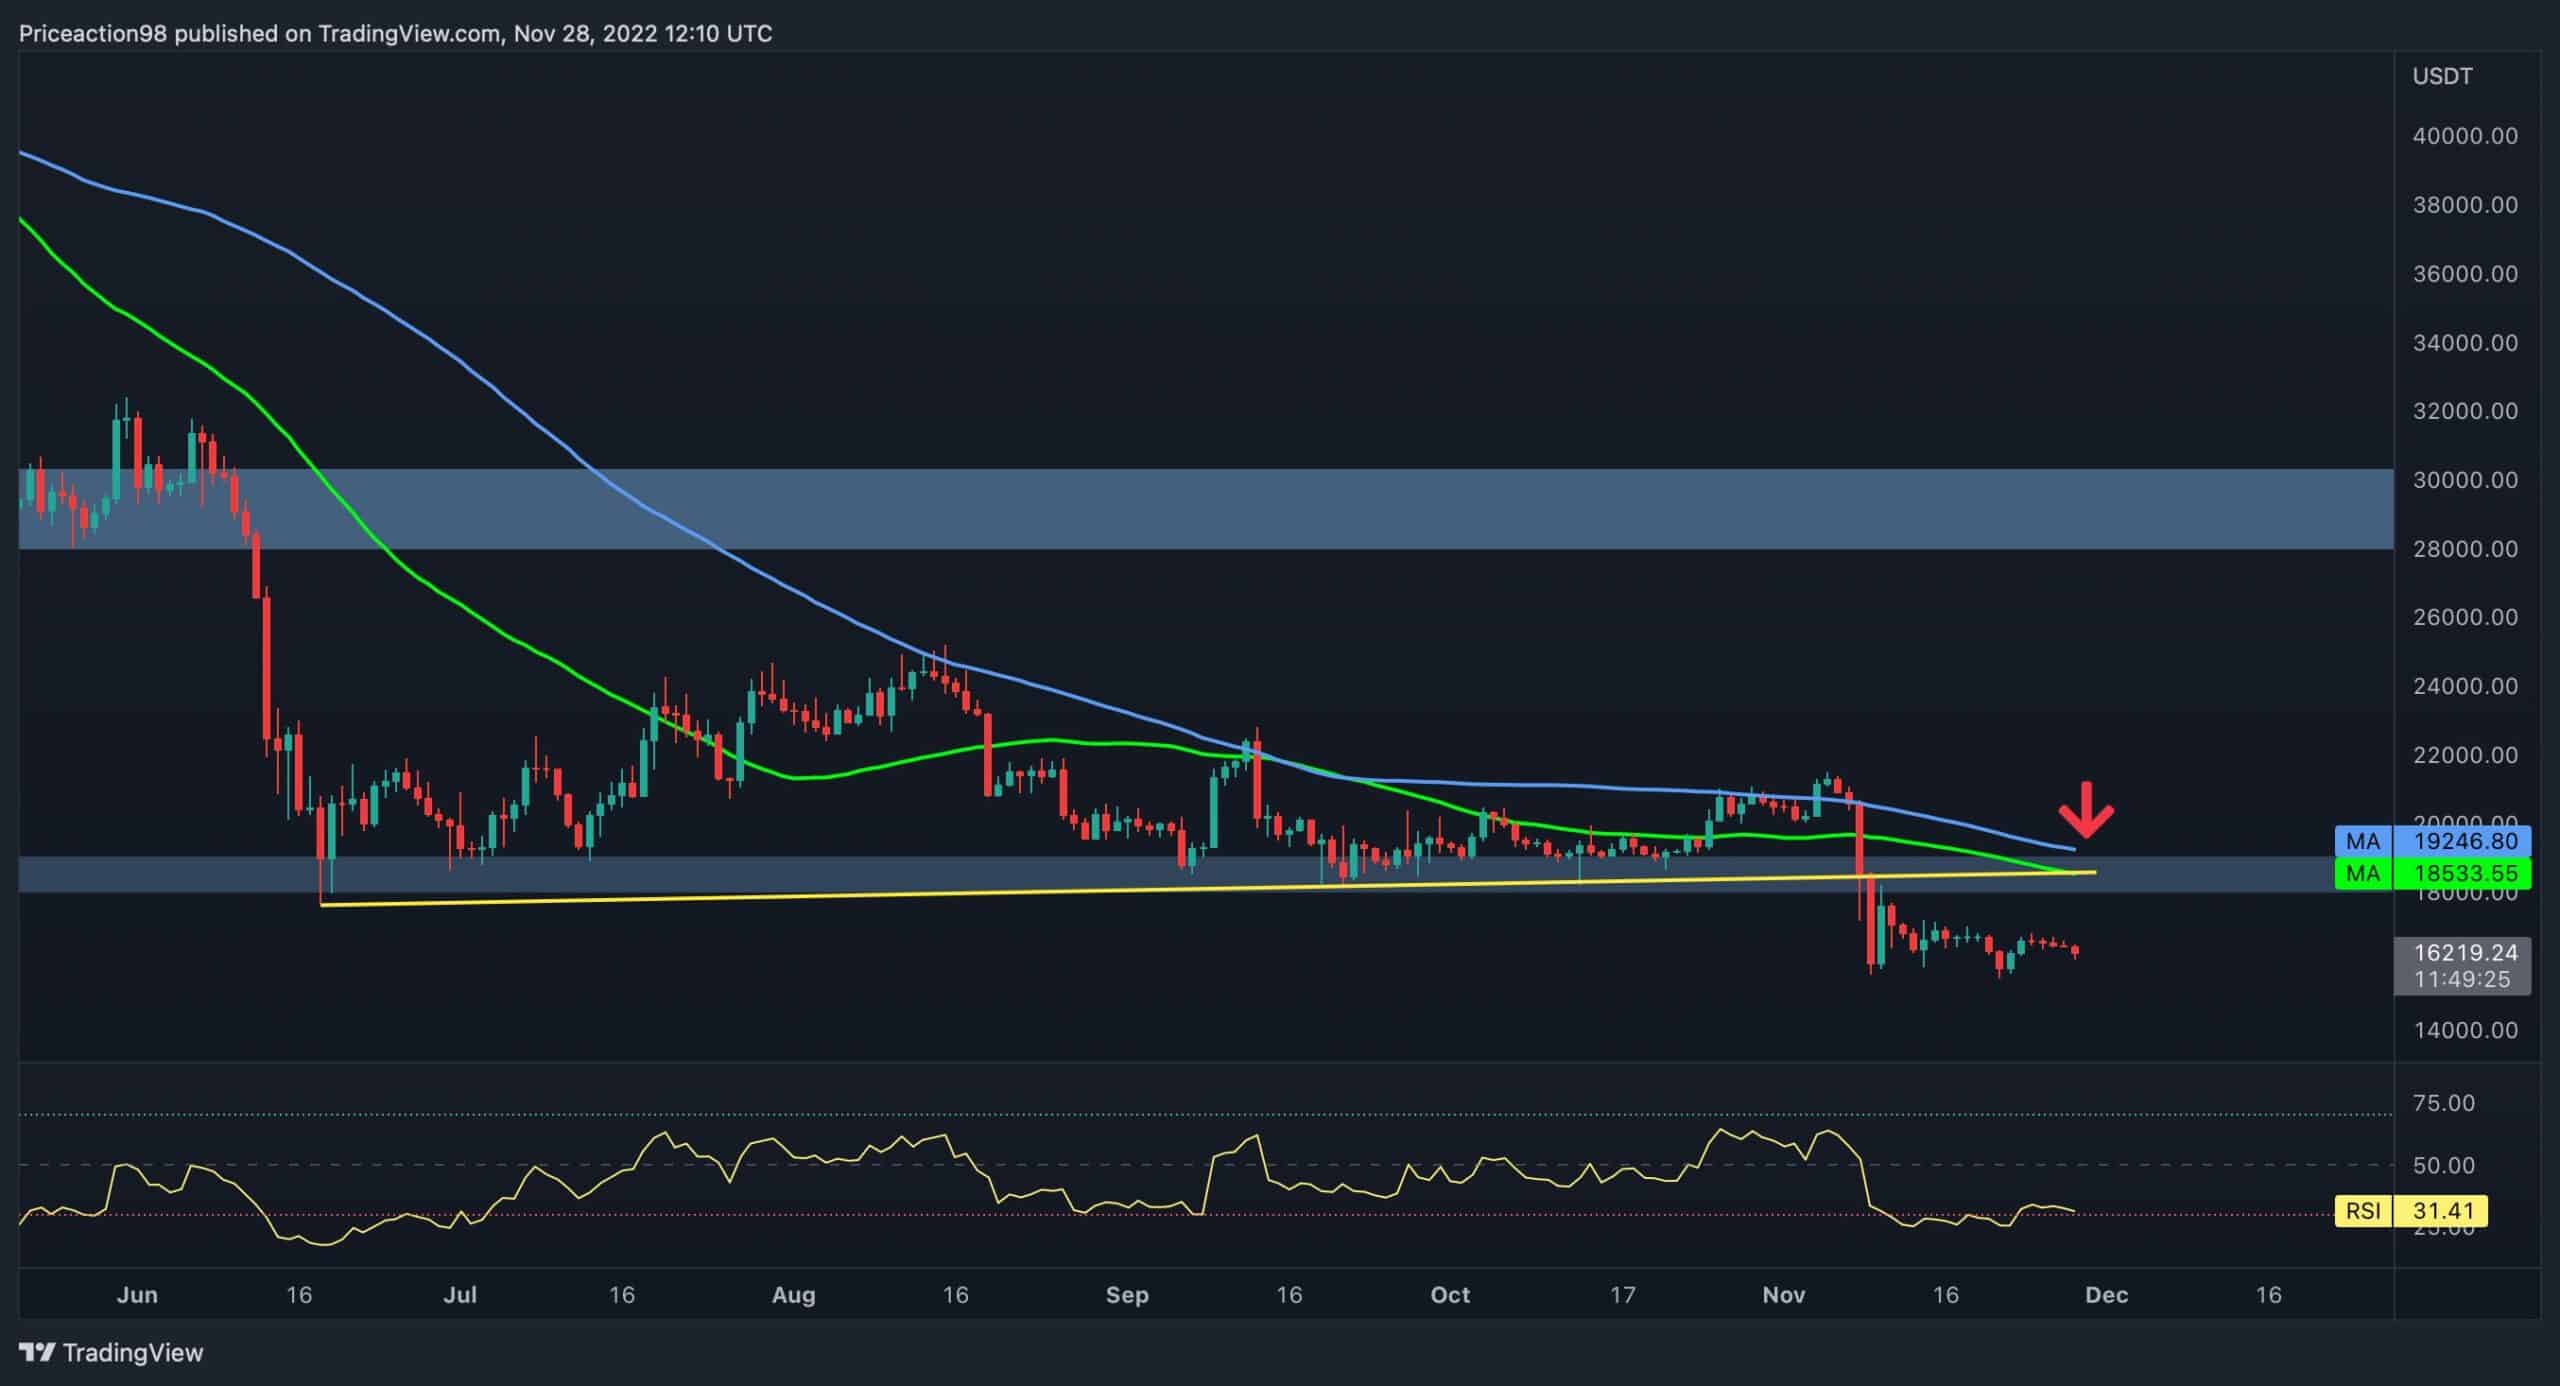
Dienos diagrama
The price is experiencing low volatility after dropping below the yellow trendline and the crucial support level at $18K. A pullback to both the trendline and the broken level is necessary if the bears are to continue the decline.
On the other hand, the broken trendline and the 100-day moving average, roughly at $19K, converge to make this static level a strong resistance.
Therefore, the most likely scenario for Bitcoin in the short term will be a consolidation toward the 100-day moving average and the broken trendline in the $18K–$19K range in order to complete the pullback.

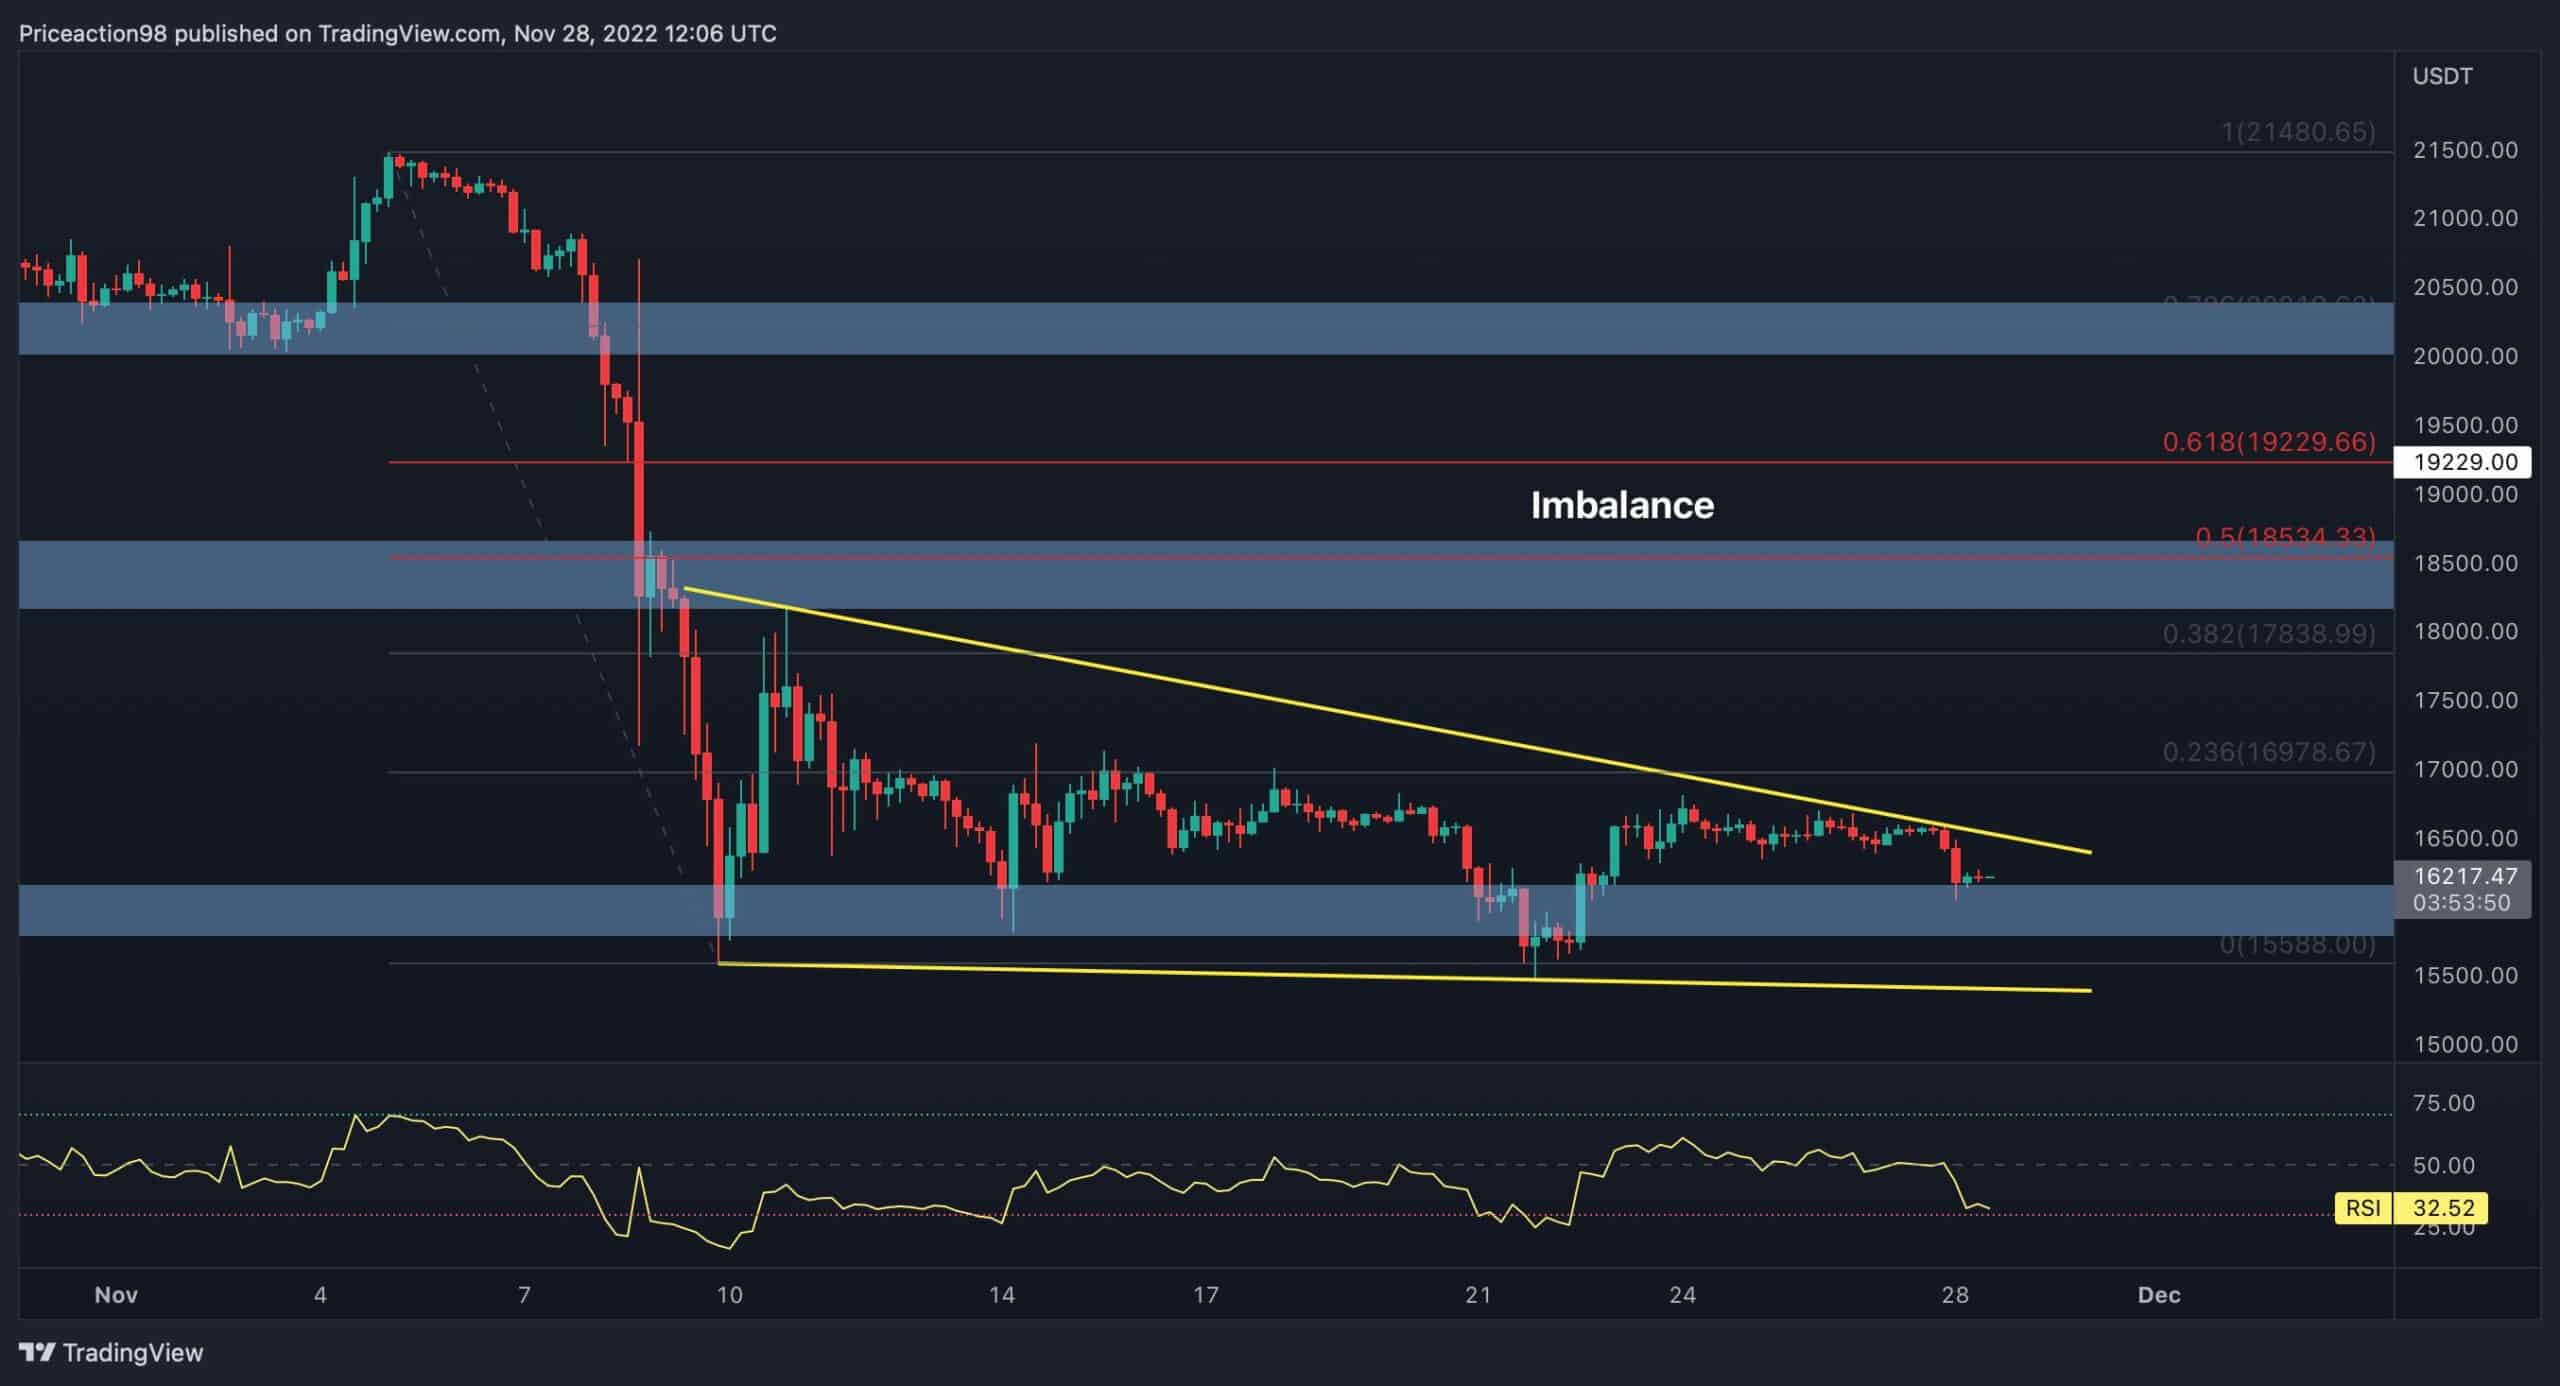
4 valandų diagrama
On the 4-hour timeframe, Bitcoin has formed a descending wedge pattern and is close to the top threshold. However, the bullish momentum doesn’t look promising as long as the market goes through this above-mentioned low volatility phase.
In addition, during the current decline, an imbalance between the $18.7K and $19.2K levels has developed, coinciding with the well-known 61.8 level of the Fibonacci retracement for the most recent bearish rally, making it a strong resistance.
In light of this, the price will likely consolidate towards the $18.5K–$19.2K range and exploit the current imbalance to extend the negative trend toward the $15K support.
Grandinės analizė
Autorius: Edris
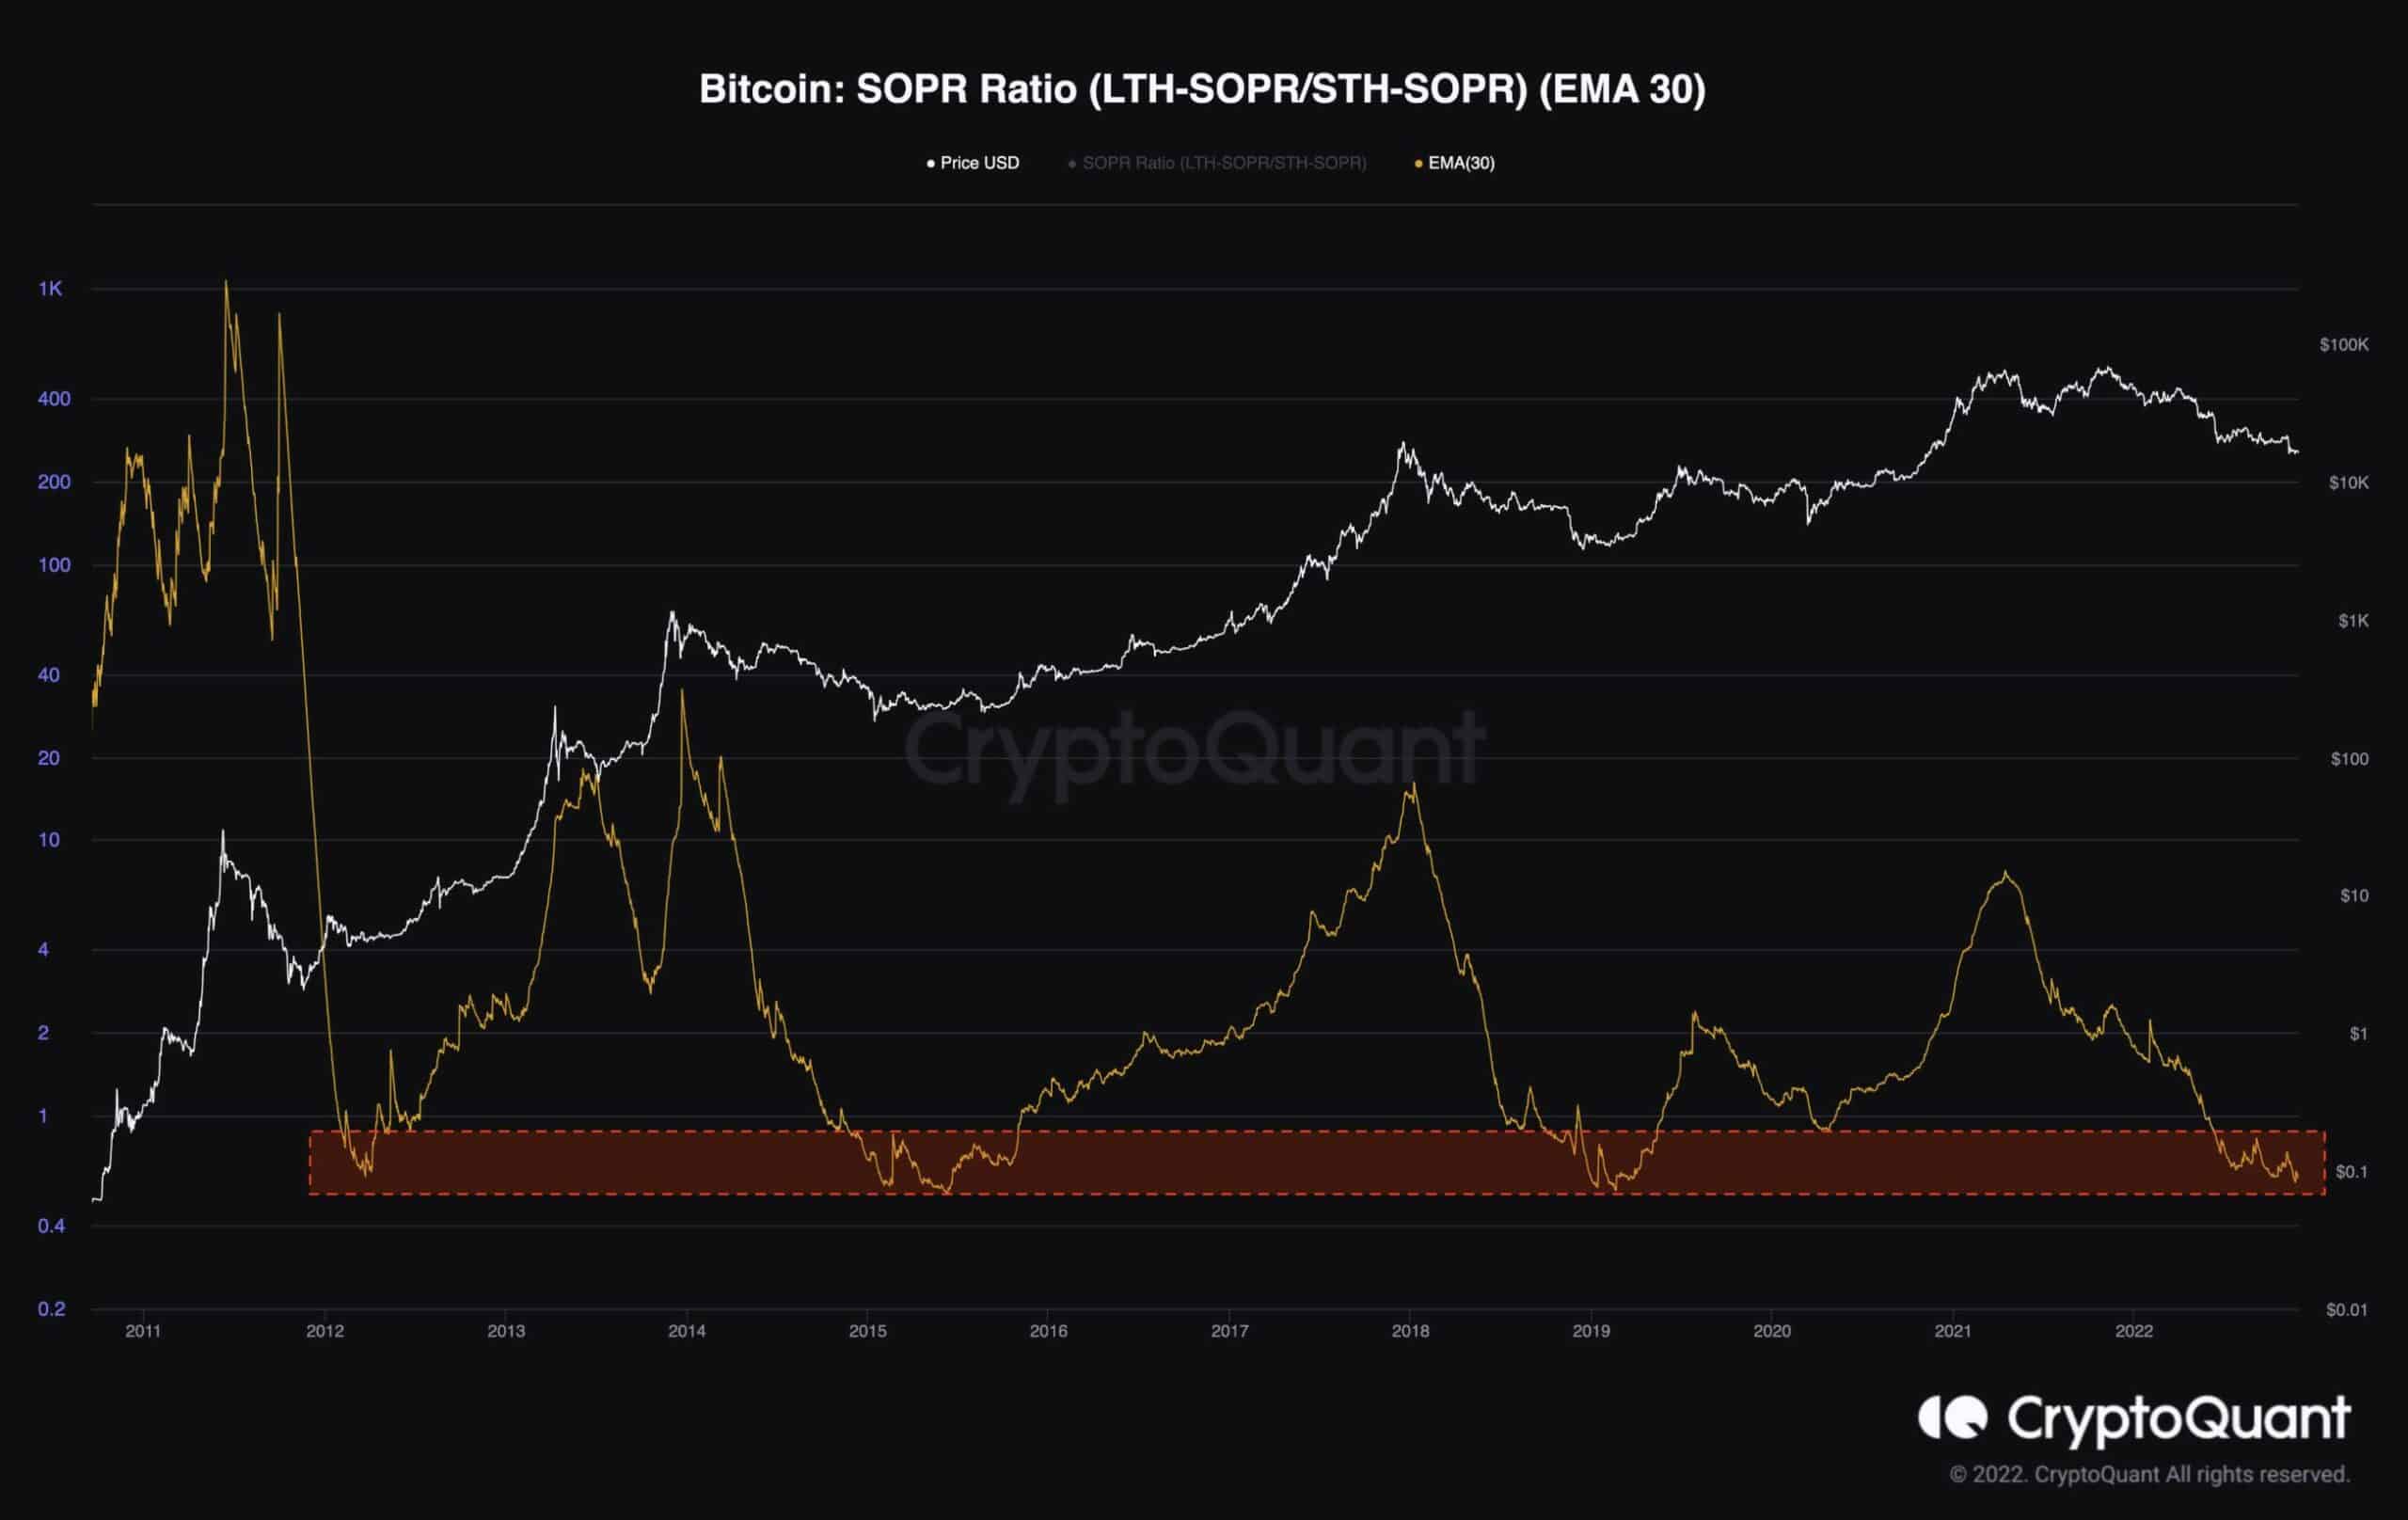
Bitcoin: SOPR Ratio (LTH/STH)
The bear market is taking its toll on investors’ portfolios as the price appears unwilling to reverse. The gruesome downtrend, paired with disastrous events like FTX’s downfall, has made many wonder if Bitcoin has finally capitulated. However, some on-chain metrics are signaling massive buying opportunities for long-term HODLing.
One of these metrics is the SOPR ratio, calculated by dividing the long-term holders’ SOPR by the short-term SOPR. Historically, values below 1 have indicated the last phase of bear markets.
The area demonstrated on the chart (red box) has been in the bottom range for the last 3 bear markets and presented buying opportunities with considerable gains in the long term. This metric has been in the mentioned area for the past few months, and so, if this cycle is anything similar to the last three, the bottom should be formed soon.
Although history is never guaranteed to be repeated, and many macroeconomic factors are pointing to a long-term recession, Bitcoin’s price is starting to look very attractive for holders who still believe in the eventual triumph of the crypto-asset.
„Binance Free“ 100 USD (išskirtinis): Naudokite šią nuorodą užsiregistruoti ir gauti 100 USD nemokamą ir 10% nuolaidą „Binance Futures“ pirmajam mėnesiui (sąlygos).
Specialus „PrimeXBT“ pasiūlymas: Naudokite šią nuorodą užsiregistruoti ir įvesti POTATO50 kodą, kad gautumėte iki 7,000 USD už savo indėlius.
Atsisakymas: „CryptoPotato“ randama informacija, kurią cituoja rašytojai. Tai neatspindi „CryptoPotato“ nuomonės, ar pirkti, parduoti ar laikyti investicijas. Prieš priimant bet kokius investicinius sprendimus, jums patariama atlikti savo tyrimus. Naudokite pateiktą informaciją savo rizika. Norėdami gauti daugiau informacijos, žr.
Kriptovaliutų diagramos pateikė „TradingView“.
Source: https://cryptopotato.com/bitcoin-volatility-plummets-but-signs-of-a-bottom-start-showing-btc-price-analysis/