BeInCrypto takes a look at Bitcoin (BTC) on-chain indicators that relate to lifespan, more specifically Dormancy and entity adjusted dormancy flow.
Kas yra mieguistumas?
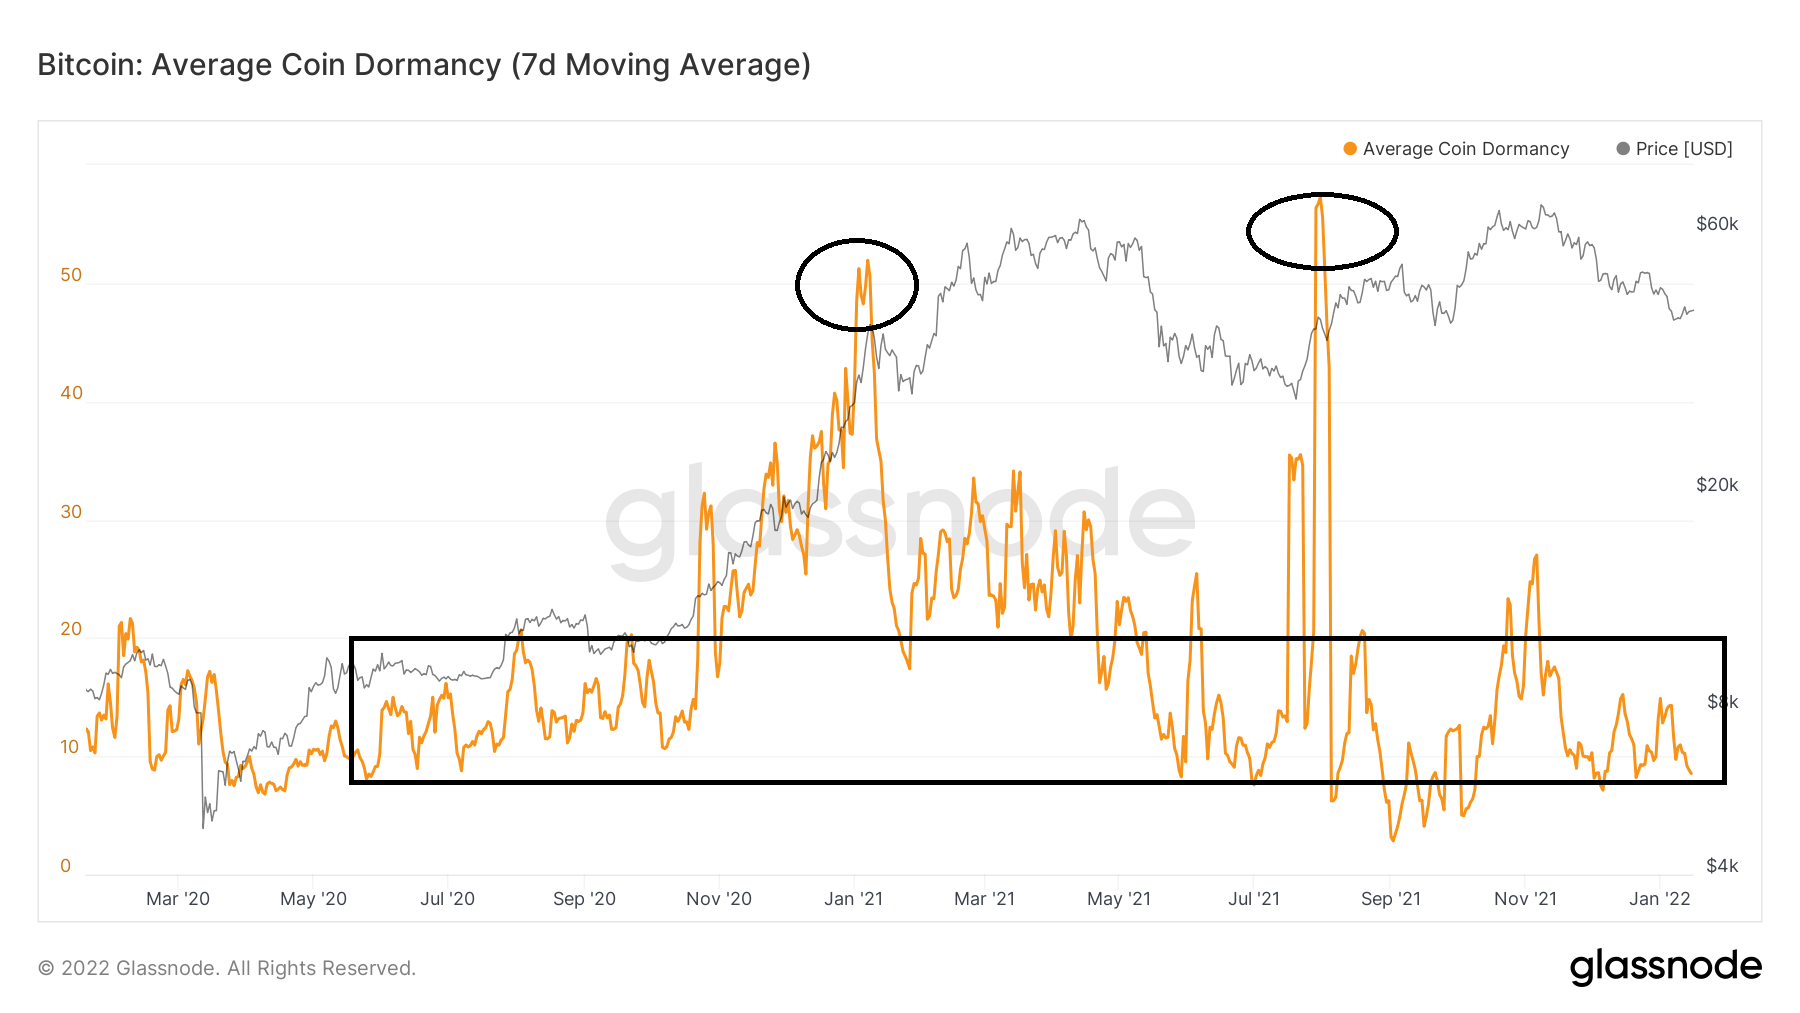
Dormancy is a lifespan indicator that measures how many coin days are destroyed per transaction on a specific day.
Therefore, the formula for the indicator is given by dividing the total coin day destruction over the total volume.
High values mean that old coins are moving, while low dormancy means that new coins are moving.

Since the bull run began in March 2020, dormancy has had two significant spikes, on Jan 7 and July 31, 2021 (black circles). During the latter date, it reached the yearly high of 57.2.
The first value was reached prior to the then April all-time high BTC price, indicating that old hands were taking profit after a considerable bull run. The second was reached when the BTC price bounced after a sharp drop. At the time, this was seen as a sign of weakness, since old hands were looking to sell at the first sign of a bounce.
Dormancy has been falling since and is currently at 8.53. This means that each transaction on average destroys 8.5 coin days. This is a relatively low value, meaning that mostly young coins are being transacted. It was last seen in May – Nov 2020, prior to the acceleration of the upward movement that led to the current all-time high.

Entity adjusted dormancy flow
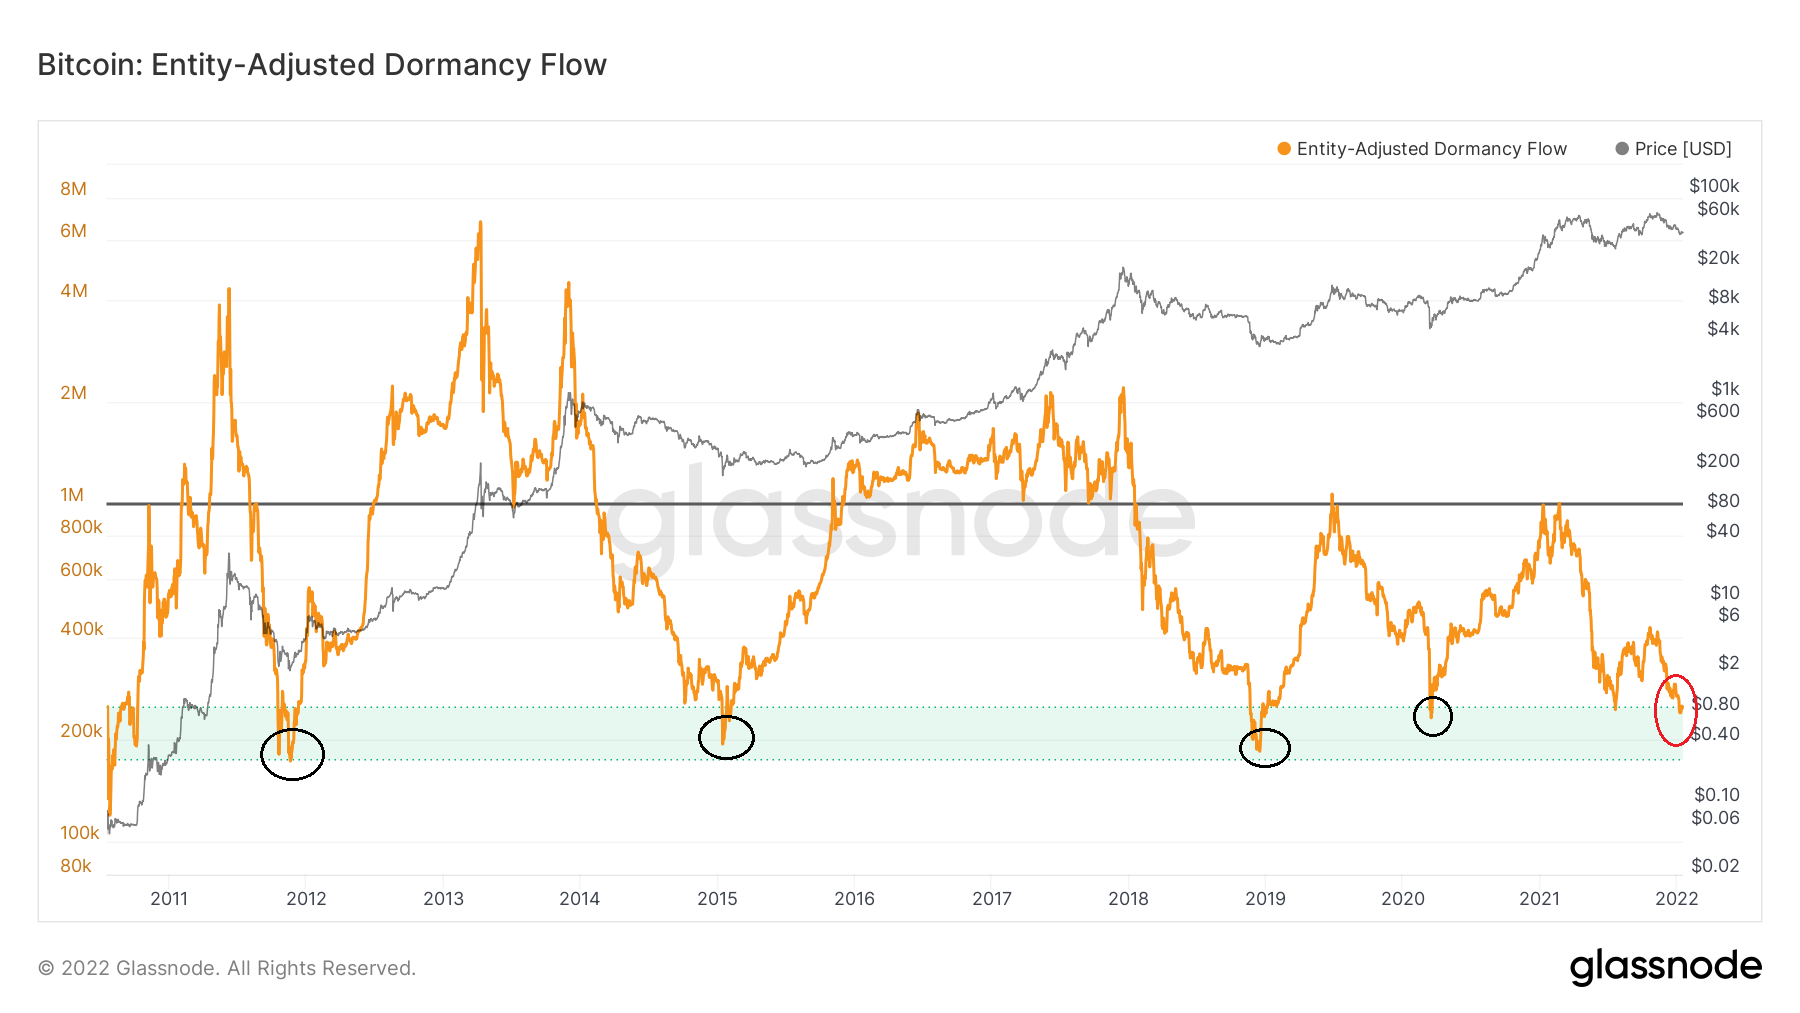
A very interesting observation comes from the Entity-Adjusted Dormancy Flow. The indicator is found by using the current market capitalization and the aforementioned dormancy values.
Historically, values between 150,000 – 250,000 have been signs of bottoms. Prior to Jan 12, they had occurred only four times (black circles). All of them have marked significant bottoms:
- Nov 2011 : 180,000
- Jan 2015 : 209,000
- Dec 2018 : 193,000
- 2020 m. kovo mėn.: 245,922 XNUMX
On Jan 12, the indicator reached a value of 243,879 (red circle). If previous history is repeated, this would mark a bottom prior to a significant bull run. This bottom would also fit with other lifespan indicator readings.
„BeInCrypto“ naujausia Bitcoin (BTC) analizė, spustelėkite čia.
Atsakomybės neigimas
Visa mūsų svetainėje esanti informacija skelbiama sąžiningai ir tik bendro pobūdžio informacijos tikslais. Bet kokie veiksmai, kuriuos skaitytojas imasi remdamasis mūsų svetainėje esančia informacija, yra griežtai jų pačių rizika.
Source: https://beincrypto.com/dormancy-flow-gives-buy-signal-for-sixth-time-in-history/