Bitcoin’s price finally seems to be breaking the $24K resistance level after a period of rejections. The cryptocurrency has rebounded from the $17K-$20K range. It surpassed the 50-day moving average but has so far been unable to breach the $24K level to the upside.
Techninė analizė
Autorius: Edris
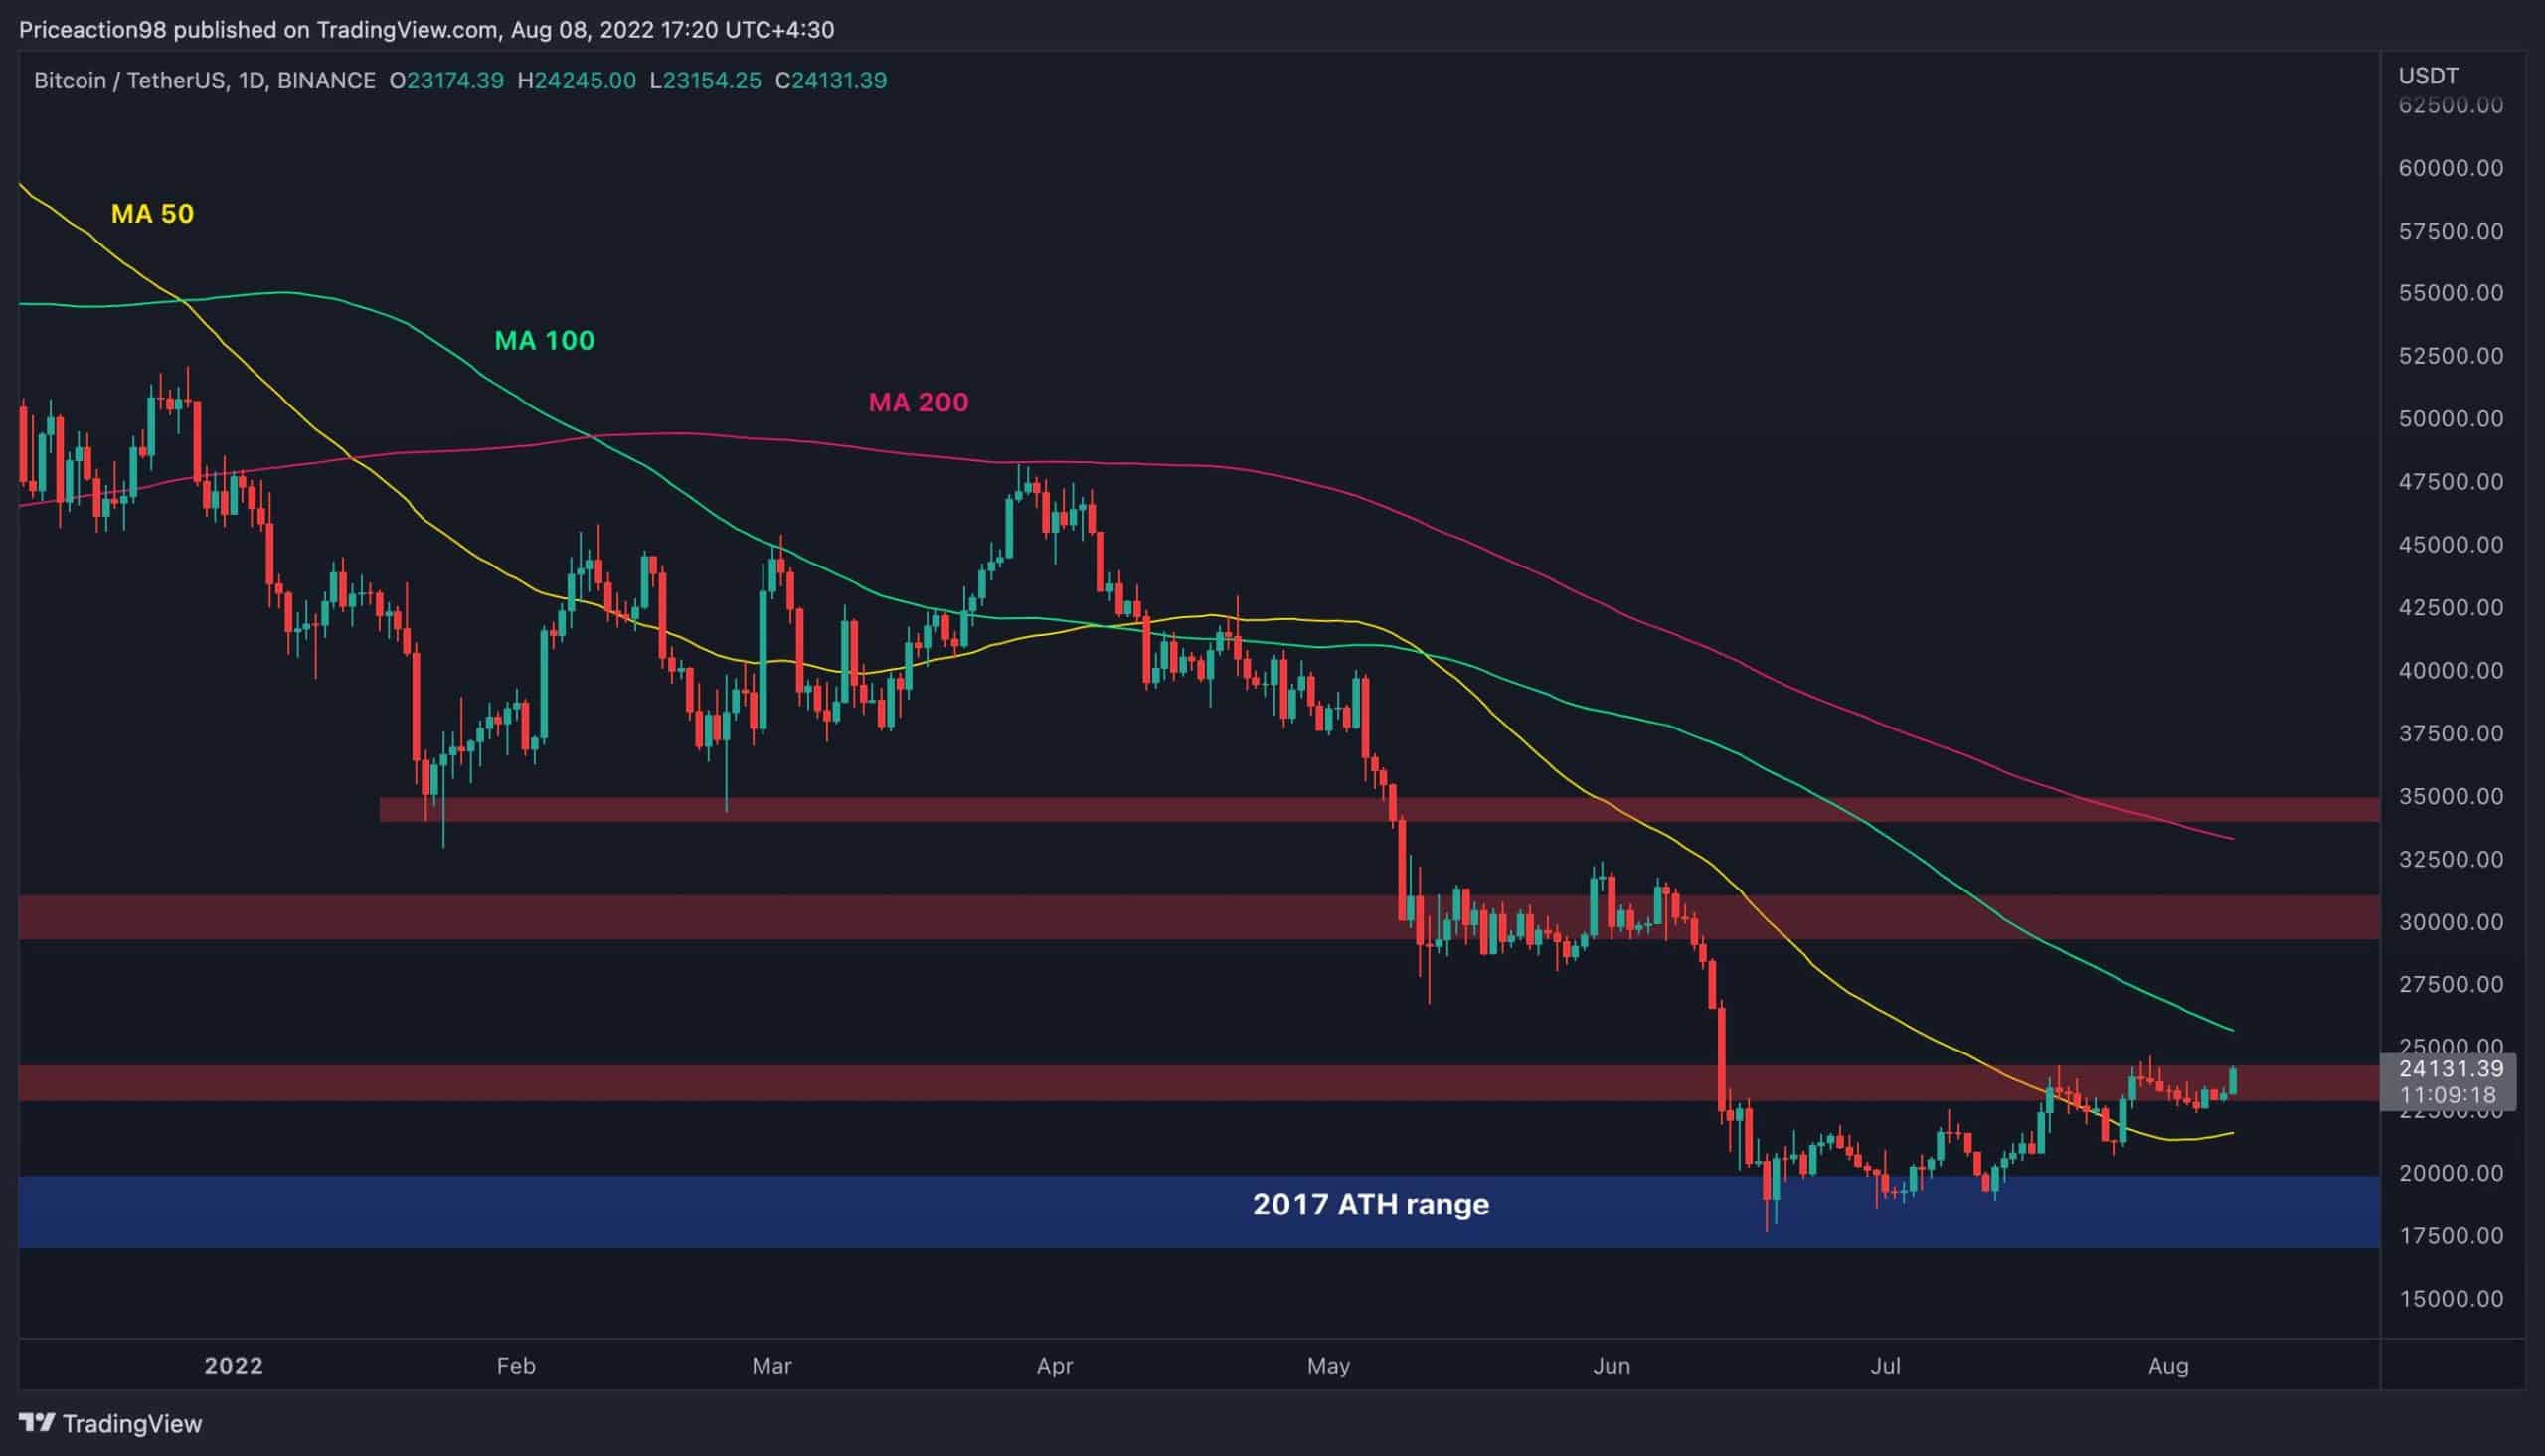
Dienos diagrama
It seems like the significant resistance level of $24K may be breached. The 100-day moving average sitting at the $26K mark would then be the next obstacle. If the price can continue above it, the $30K supply zone would be the short-term target.
On the flip side, if the price fails to break the moving average and drops below the $24K mark, another bearish continuation could begin. This could result in a potential crash below the $20K support.
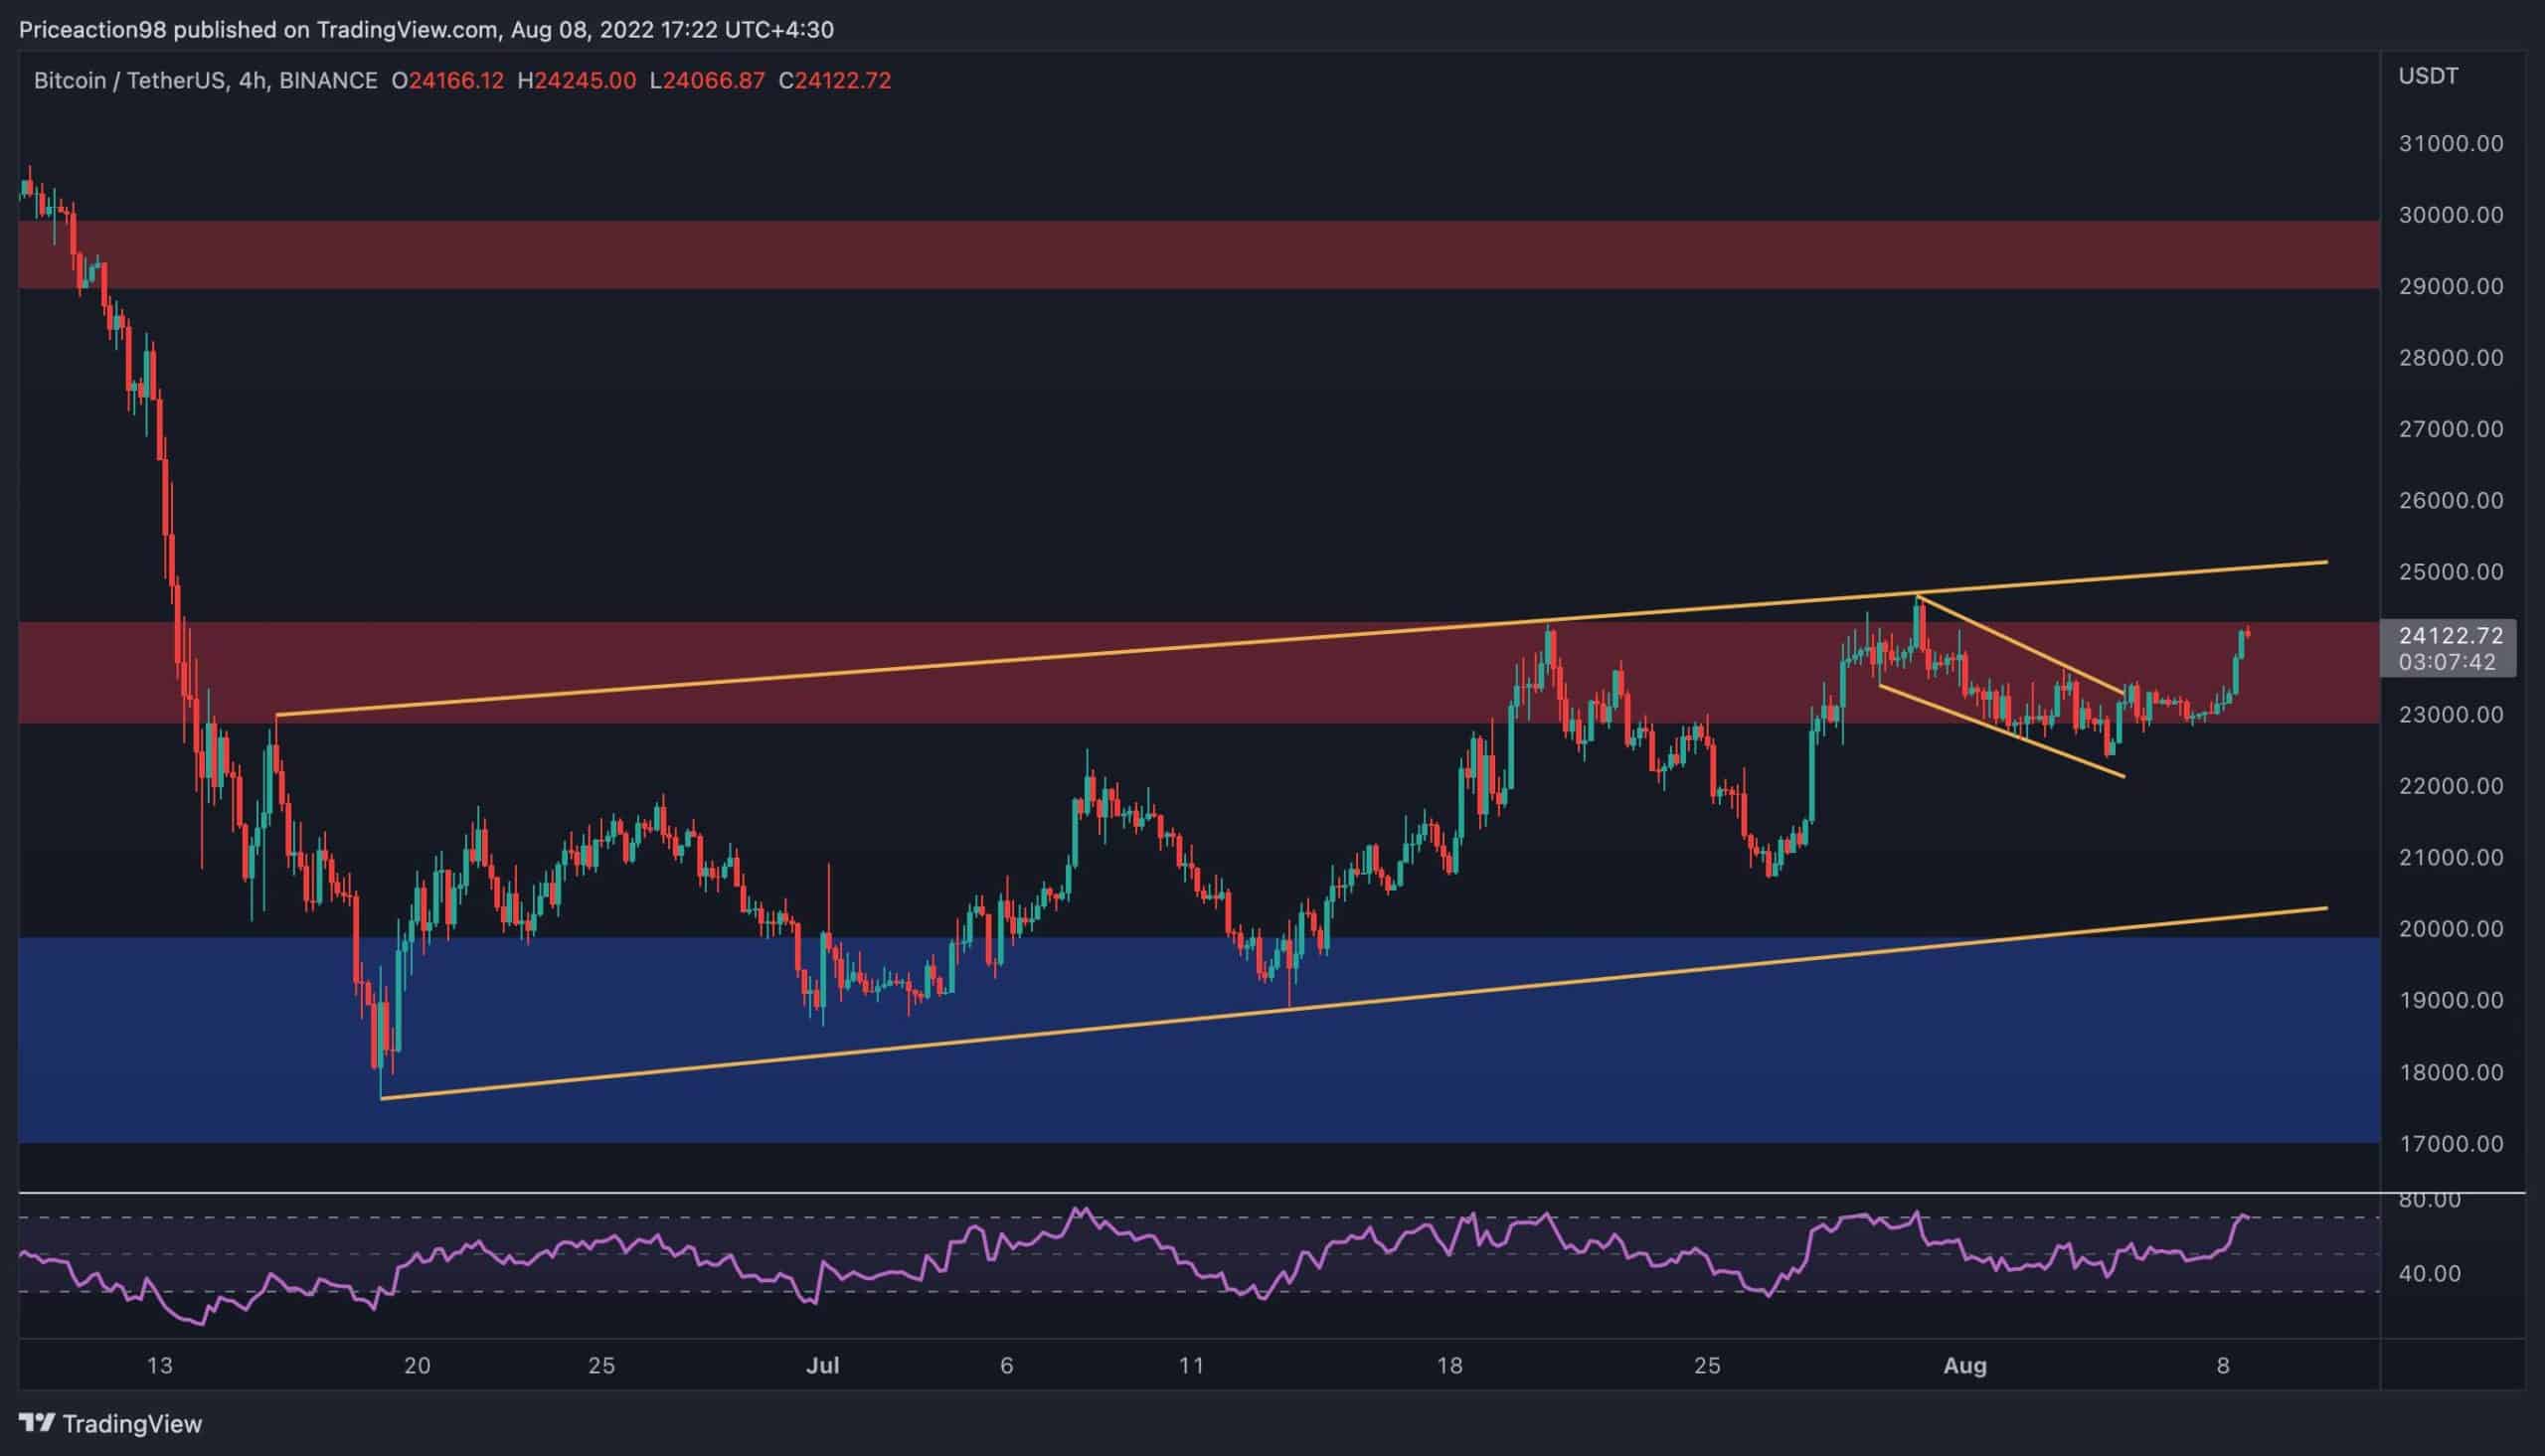
4 valandų diagrama
On the 4-hour timeframe, the price managed to break the small bullish flag and rallied towards the $24K mark. However, the larger bearish flag is yet to be broken, as the bulls begin their fourth attempt at the higher boundary of the pattern. A valid breakout above the flag would likely lead to a rally towards the $30K supply zone.
At the same time, the RSI indicator is currently signaling an overbought state. This could result in either a short-term pullback or an overall bearish reversal. If the latter is true, a bearish breakout from the flag and continuation below $20K, and even $15K, would be probable. The lower timeframe price action should be monitored carefully this week to determine which scenario is more likely, and act accordingly.
Grandinės analizė
Autorius: Edris
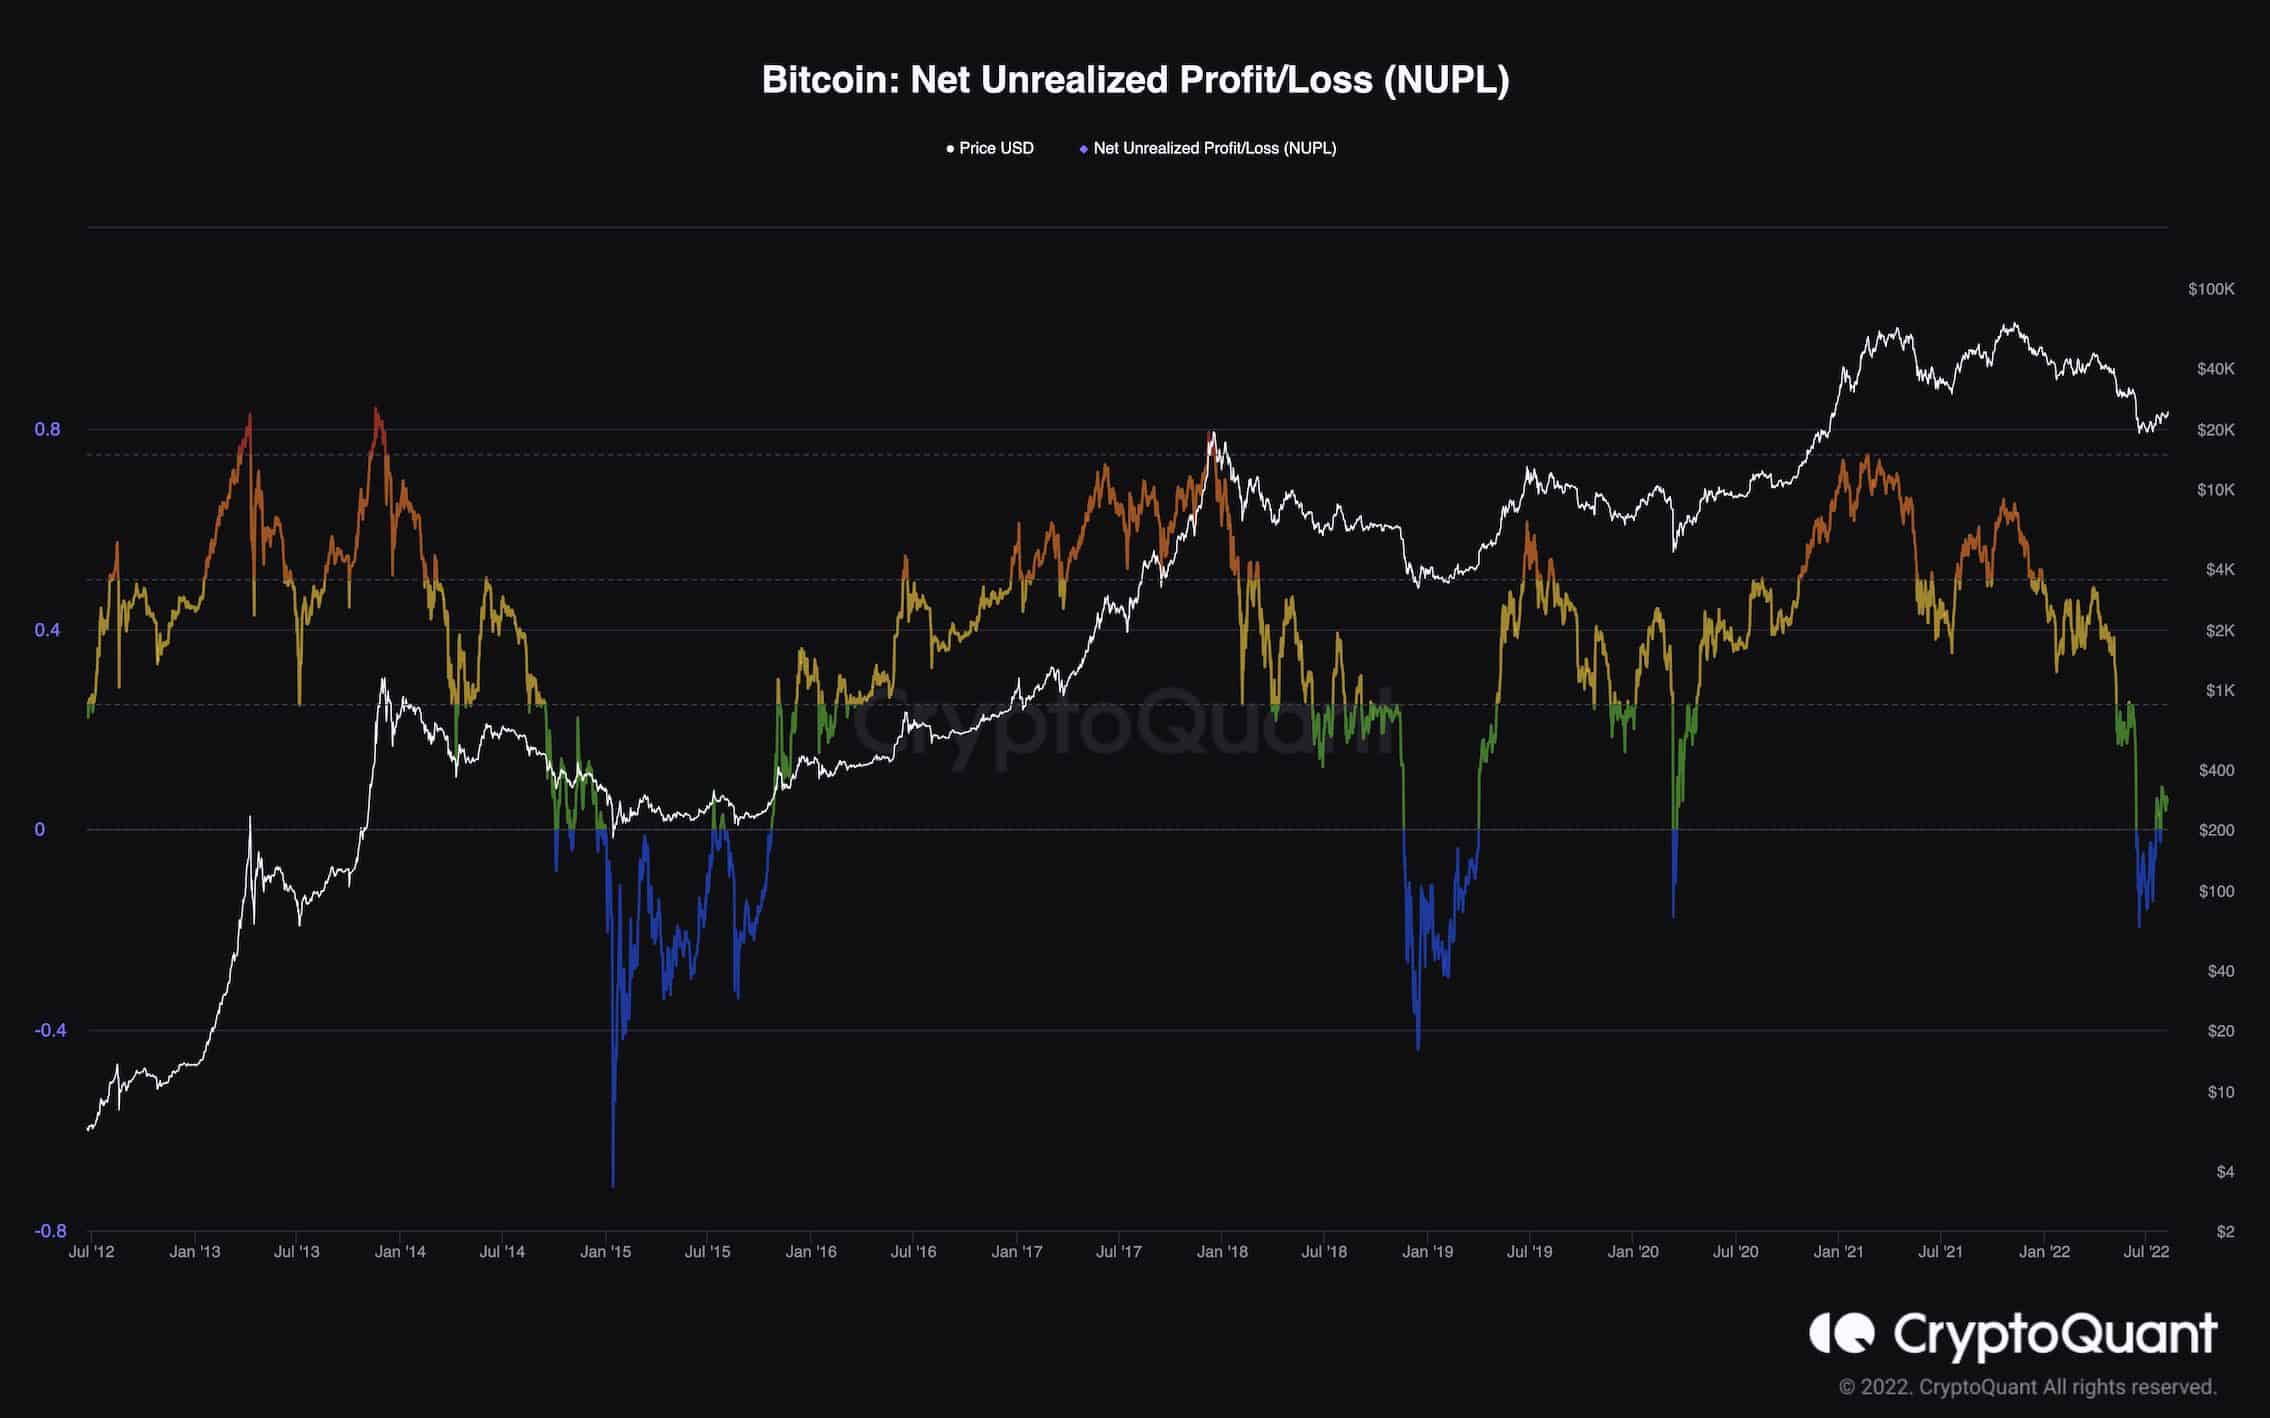
Bitcoin grynasis nerealizuotas pelnas / nuostolis
Bitcoin’s strong downtrend over the last few months has put immense pressure on all market participants. Many investors have sold their coins at massive losses and exited the market, fearing more downturn.
And yet, according to Net Unrealized Profit/Losses metric, the market might be nearing the bottom. This metric measures the ratio of unrealized profits/losses. It is a useful indicator to evaluate market sentiment. The market has felt bleak in recent months, as the NUPL metric was demonstrating values below 0 – a region that has identified previous bottoms.
During the recent increase in price, the NUPL has moved back above 0. This has previously signaled the end of bear markets and the beginning of a new uptrend. It’s important to note that other metrics and the overall macroeconomic picture must also be monitored in the short term to determine whether a new bull market or another bull trap is the case.
„Binance Free“ 100 USD (išskirtinis): Naudokite šią nuorodą užsiregistruoti ir gauti 100 USD nemokamą ir 10% nuolaidą „Binance Futures“ pirmajam mėnesiui (sąlygos).
Specialus „PrimeXBT“ pasiūlymas: Naudokite šią nuorodą užsiregistruoti ir įvesti POTATO50 kodą, kad gautumėte iki 7,000 USD už savo indėlius.
Atsisakymas: „CryptoPotato“ randama informacija, kurią cituoja rašytojai. Tai neatspindi „CryptoPotato“ nuomonės, ar pirkti, parduoti ar laikyti investicijas. Prieš priimant bet kokius investicinius sprendimus, jums patariama atlikti savo tyrimus. Naudokite pateiktą informaciją savo rizika. Norėdami gauti daugiau informacijos, žr.
Kriptovaliutų diagramos pateikė „TradingView“.
Source: https://cryptopotato.com/heres-the-next-target-for-bitcoin-if-24k-falls-btc-price-analysis/