A popular crypto analyst says that an on-chain indicator with a track record of calling tops and bottoms is strongly suggesting that Bitcoin (BTC) is in for significant price appreciation.
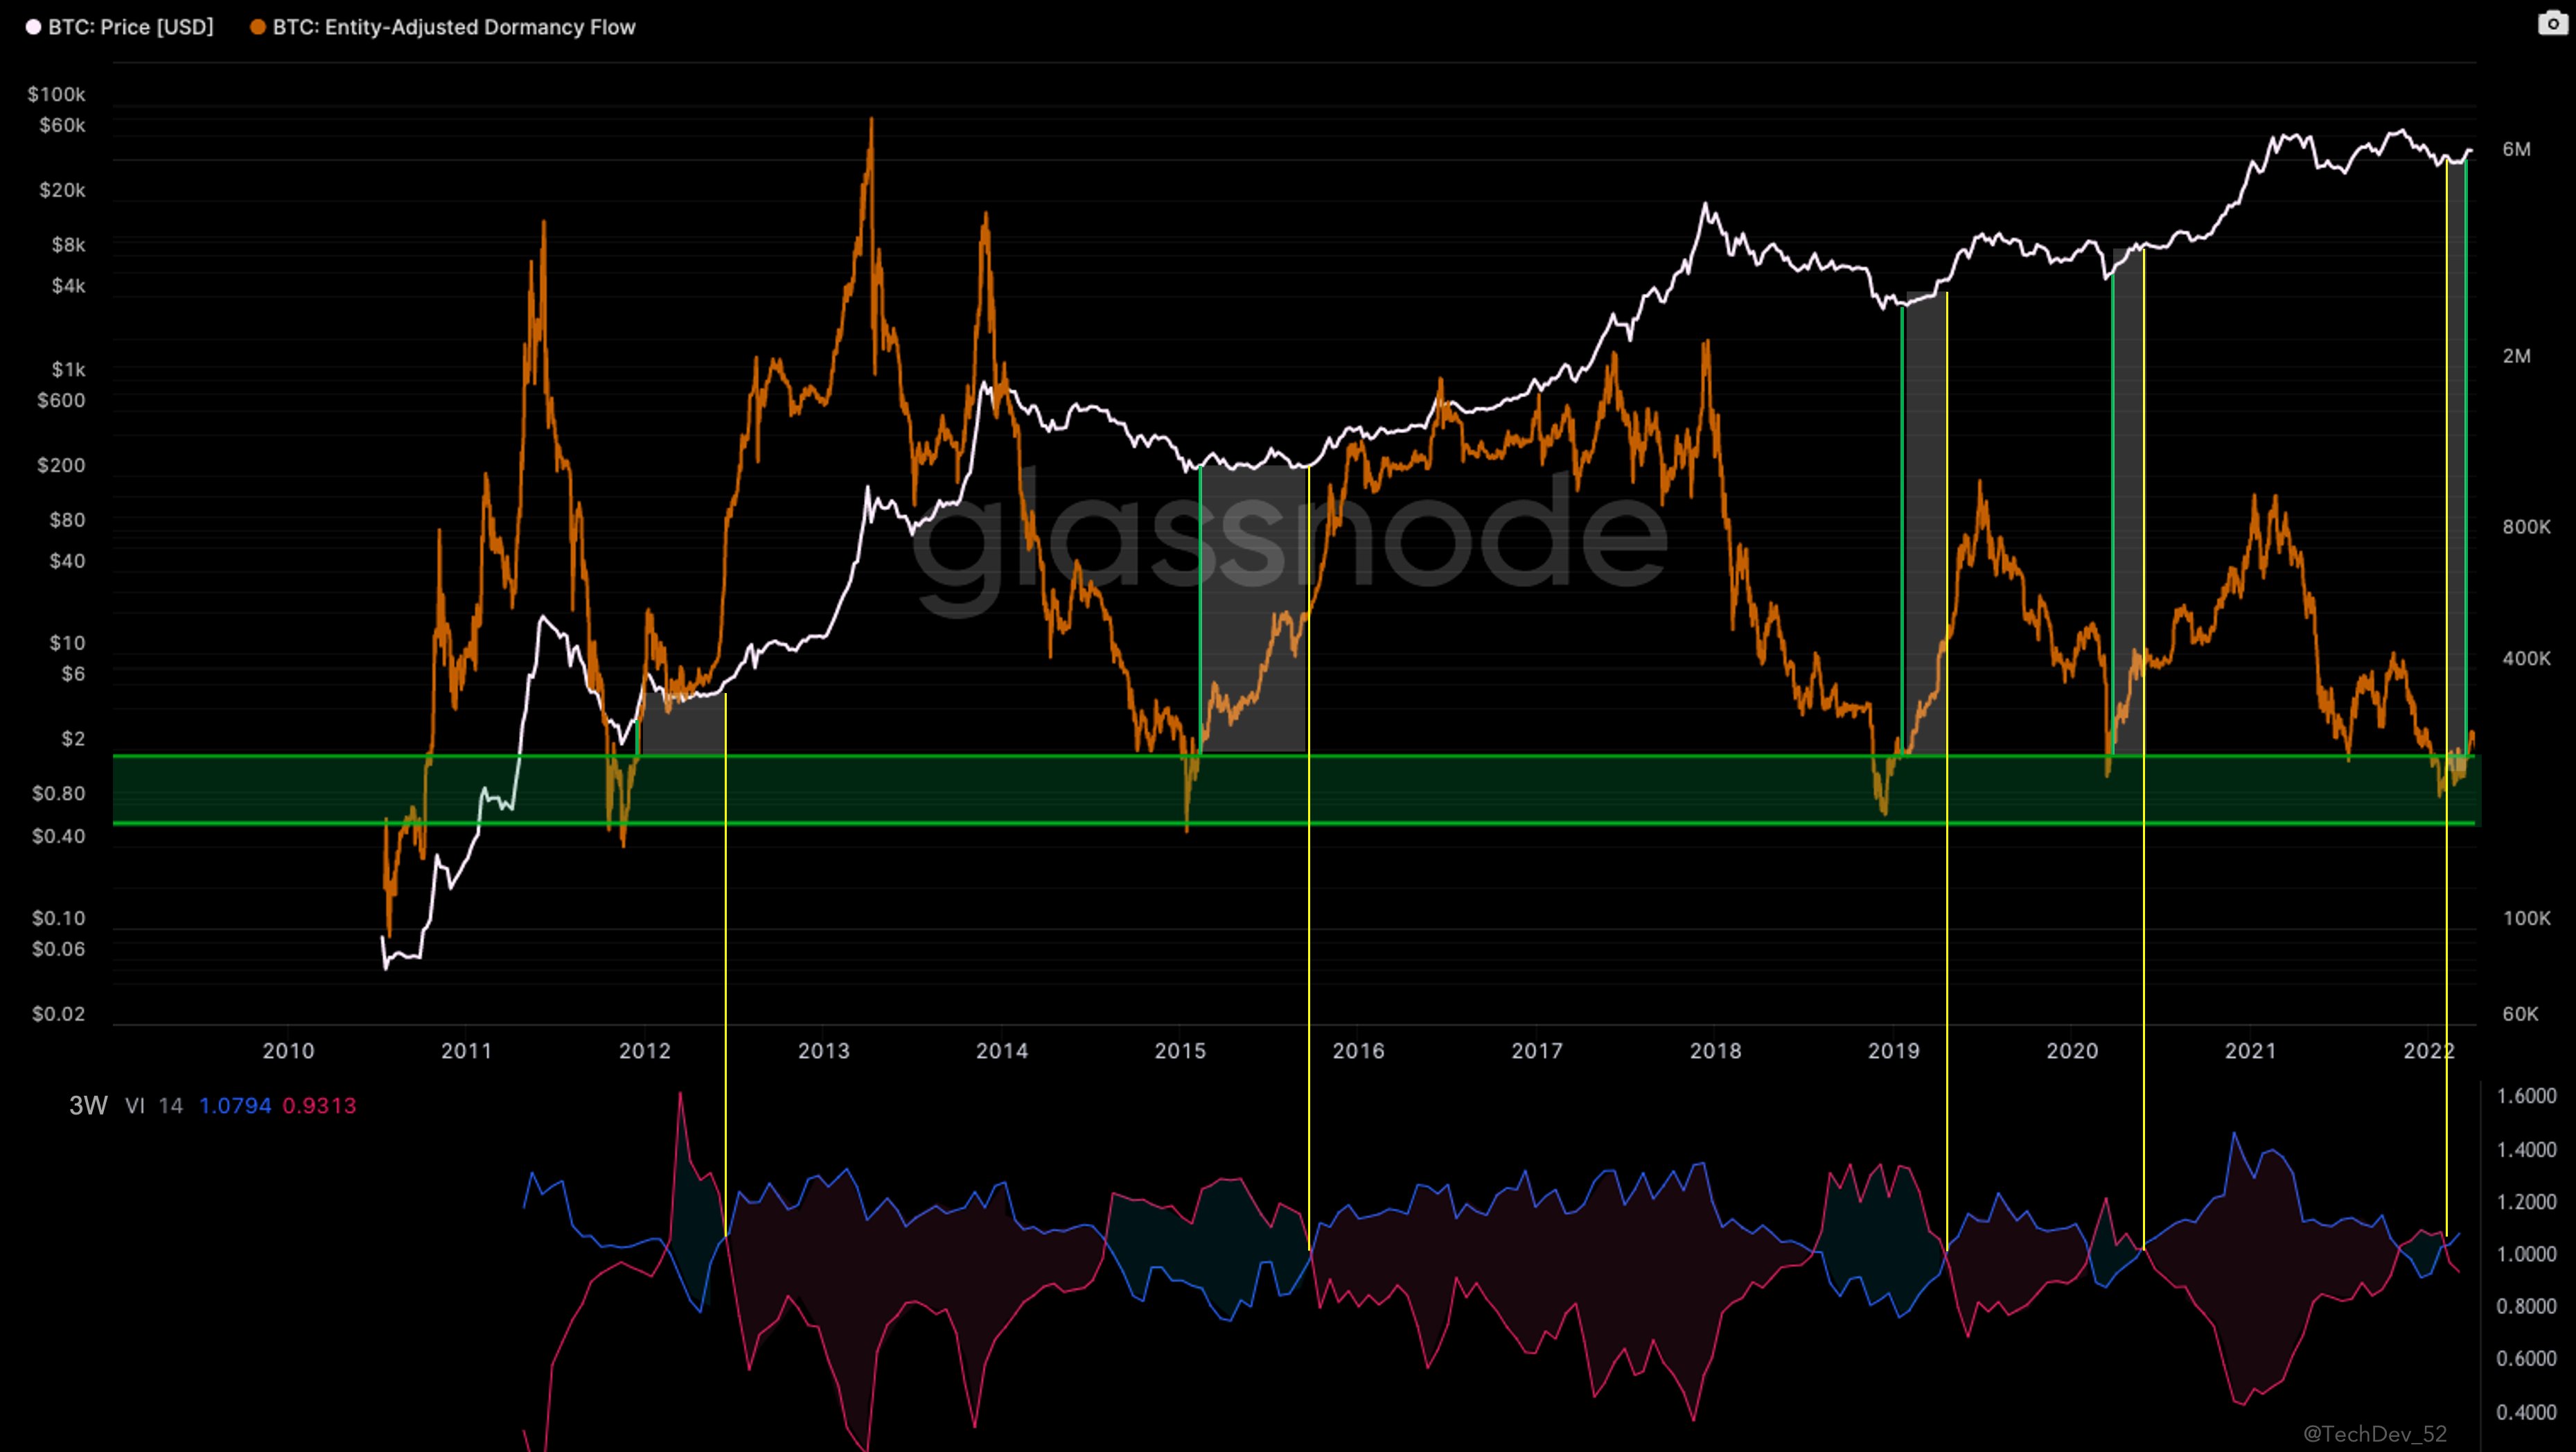
The pseudonymous analyst known as TechDev tells his 382,000 Twitter followers that he’s watching Bitcoin’s dormancy flow metric, which measures the average number of days that coins have remained untouched.
He combines the dormancy flow with three-week candles on the vortex cross, which uses historical price data to identify trend reversals.
“The periods between dormancy flow exiting the green zone and the three-week bullish vortex cross have offered some of the best buy opportunities for Bitcoin over the last 10 years.
Asymmetry very much to the upside here in my view.
Enjoy your weekend.”
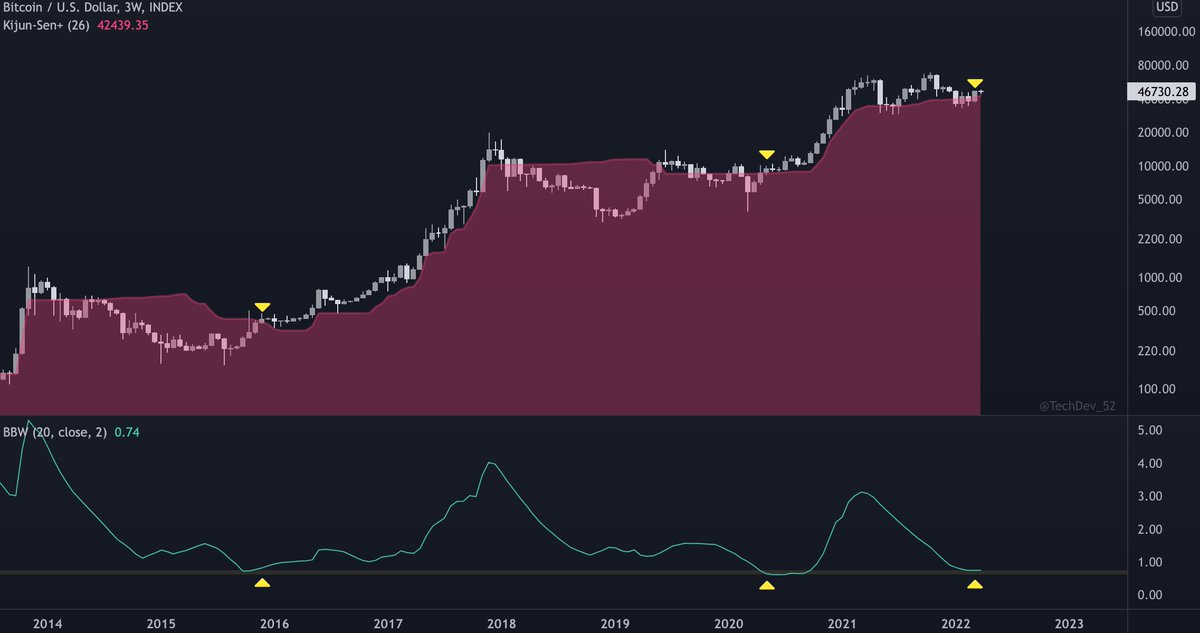
TechDev also presents another chart combining two indicators that suggest bullish price action on the horizon. He says that Bitcoin is holding above the Kijun-Sen, which is traditionally used in the Ichimoku Cloud and calculates the mean price of the last 26 periods.
The analyst combines the Kijun-Sen with an indicator depicting the progressive width of Bollinger Bands.
Traditionally, a low or narrow Bollinger Band width indicates that the asset is gearing up for volatile price action.
“Bitcoin has reclaimed the three-week Kijun-Sen at historically low Bollinger Band width.
Suggests macro bullish momentum with impending volatility.”
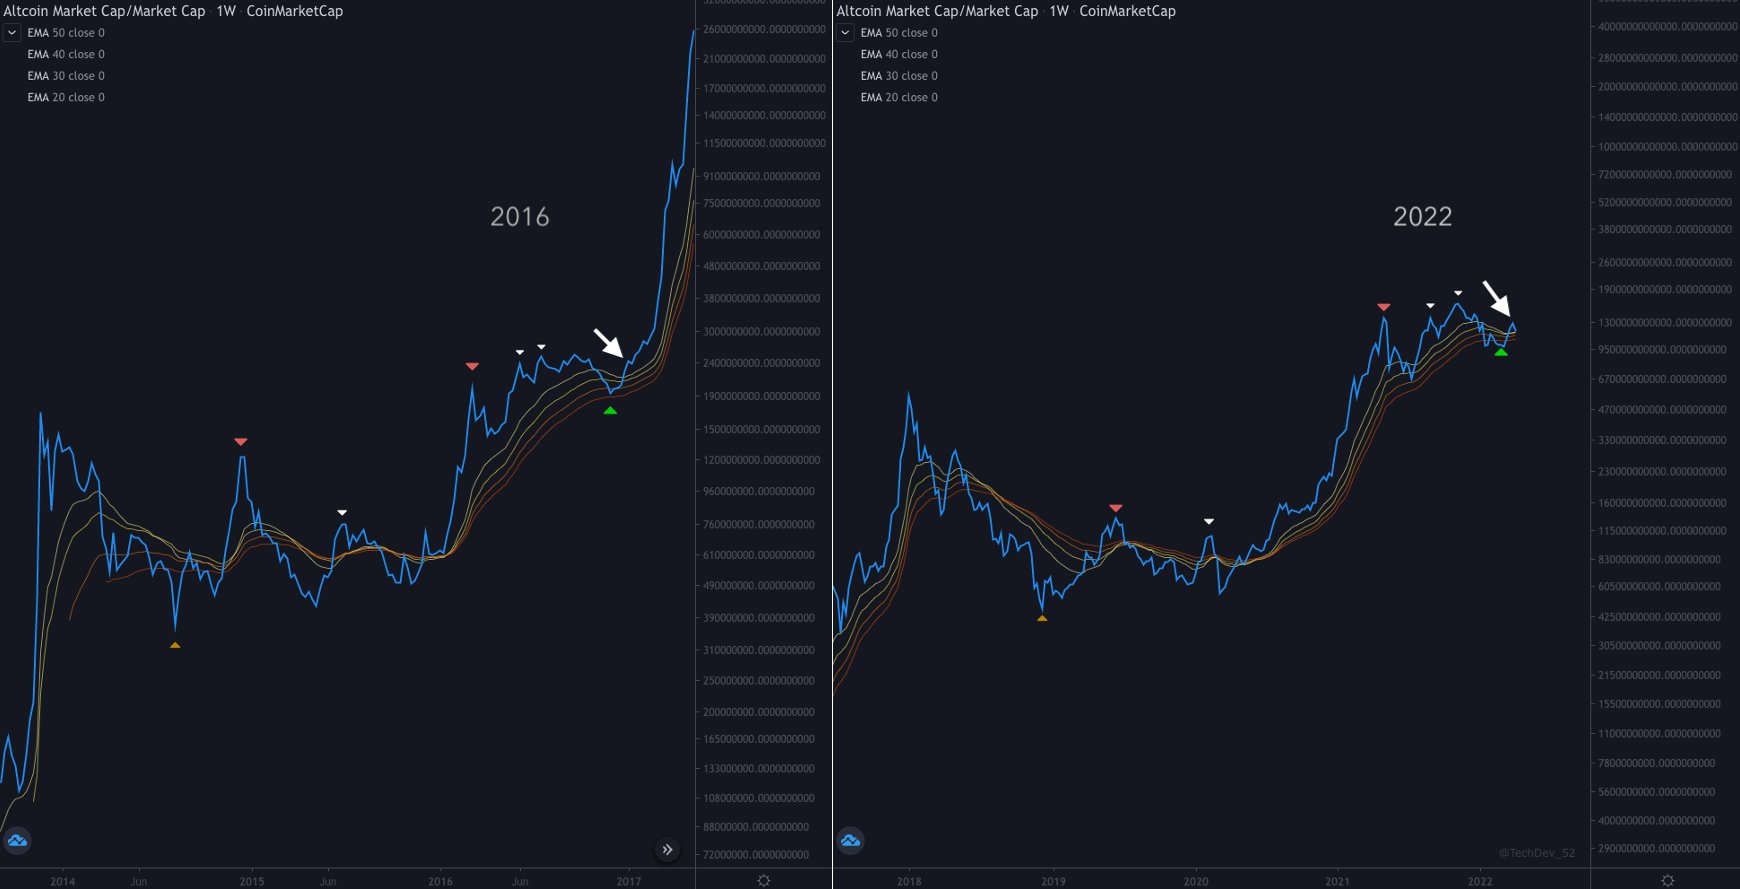
Looking at altcoins, TechDev also says bullish implications are hiding in the charts.
He looks at a weekly chart of the market cap of the entire altcoin market and says that it is currently establishing convincing support on several critical exponential moving averages (EMA), similar to 2016 before huge rallies.
“Altcoin Market Cap Weekly
Hold the EMA ribbon.”
Tikrinti Kaina veiksmų
Sekite mus Twitter, Facebook ir Telegram
Surf „Daily Hodl Mix“

Atsisakymas: „The Daily Hodl“ išsakytos nuomonės nėra patarimas dėl investavimo. Investuotojai turėtų atlikti deramą patikrinimą prieš imdamiesi bet kokių didelės rizikos investicijų į „Bitcoin“, kriptovaliutą ar skaitmeninį turtą. Informuojame, kad už savo pervedimus ir sandorius esate atsakingi patys, o už visus nuostolius, kuriuos galite patirti, esate atsakingas jūs. „Daily Hodl“ nerekomenduoja pirkti ar parduoti jokios kriptovaliutos ar skaitmeninio turto, taip pat „The Daily Hodl“ nėra patarėjas dėl investavimo. Atkreipkite dėmesį, kad „The Daily Hodl“ dalyvauja filialų rinkodaroje.
Teminis vaizdas: Shutterstock/digitalart4k/Natalia Siiatovskaia
Source: https://dailyhodl.com/2022/04/10/historically-accurate-on-chain-indicator-shows-bitcoin-btc-has-asymmetric-upside-says-crypto-analyst/