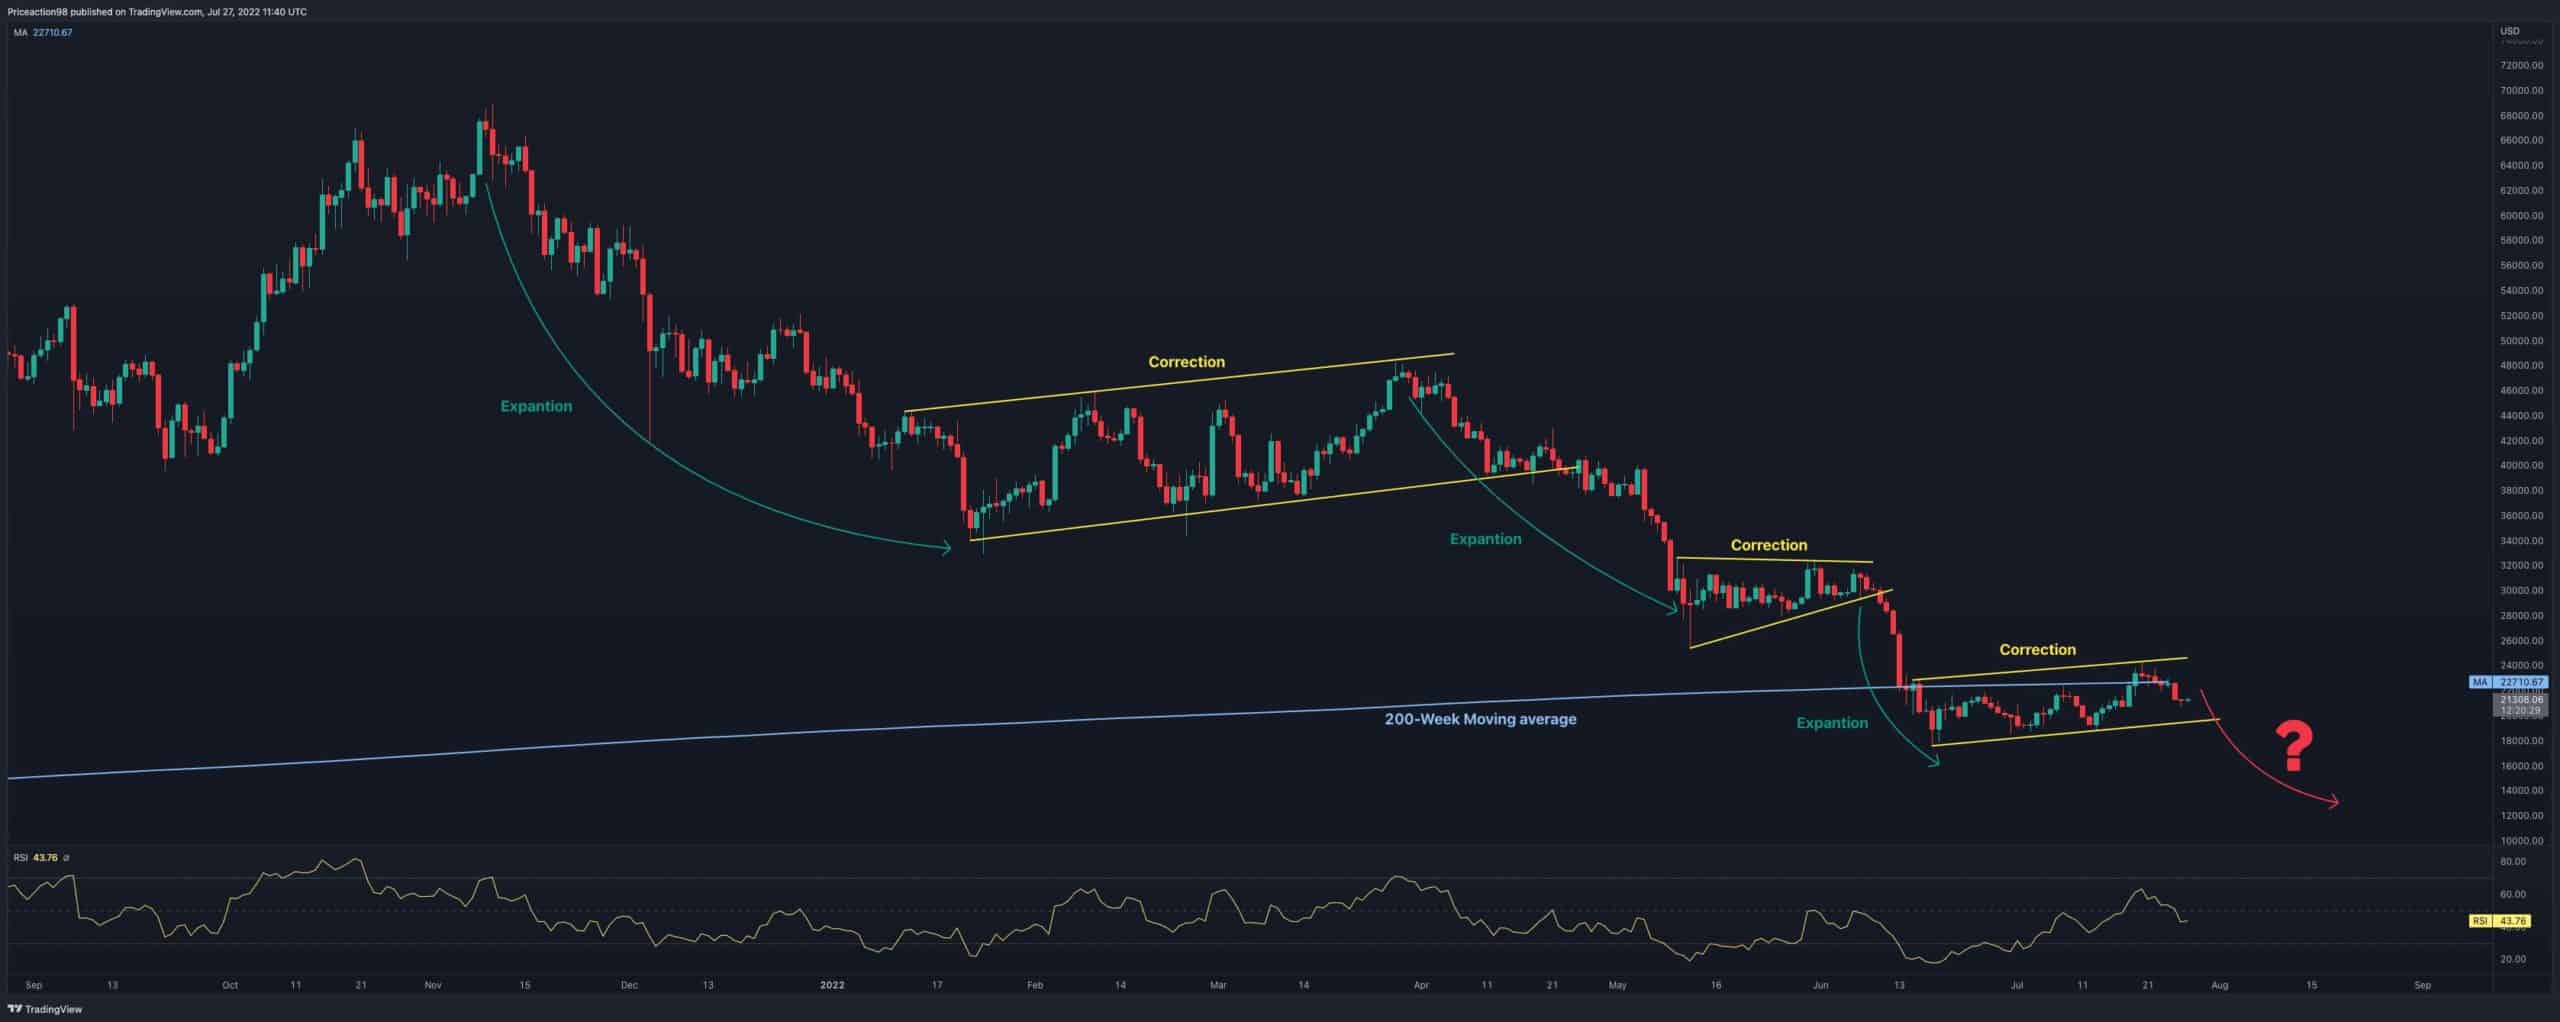
Market movements are frequently consisting of two phases – an expansion phase where the price changes sharply in either direction, followed by a correction phase in which the price forms continuation patterns. This analysis aims to examine this structure throughout the ongoing bear market.
Techninė analizė
By shayan
Savaitės diagrama
Bitcoin has been descending since the late 2021 ATH and forming expansion moves followed by correction phases. Currently, the price has dropped below its 200-week moving average (~$23K), which is the most critical and decisive level for Bitcoin, followed by a pullback. Meanwhile, the cryptocurrency has formed a continuation correction pattern and was rejected from the upper boundary.
Considering the mentioned price action patterns, there is a good chance that Bitcoin will plunge from this price level and reach lower demand regions. However, the probable bearish leg might be the last move down to complete the capitulation event between the market participants.
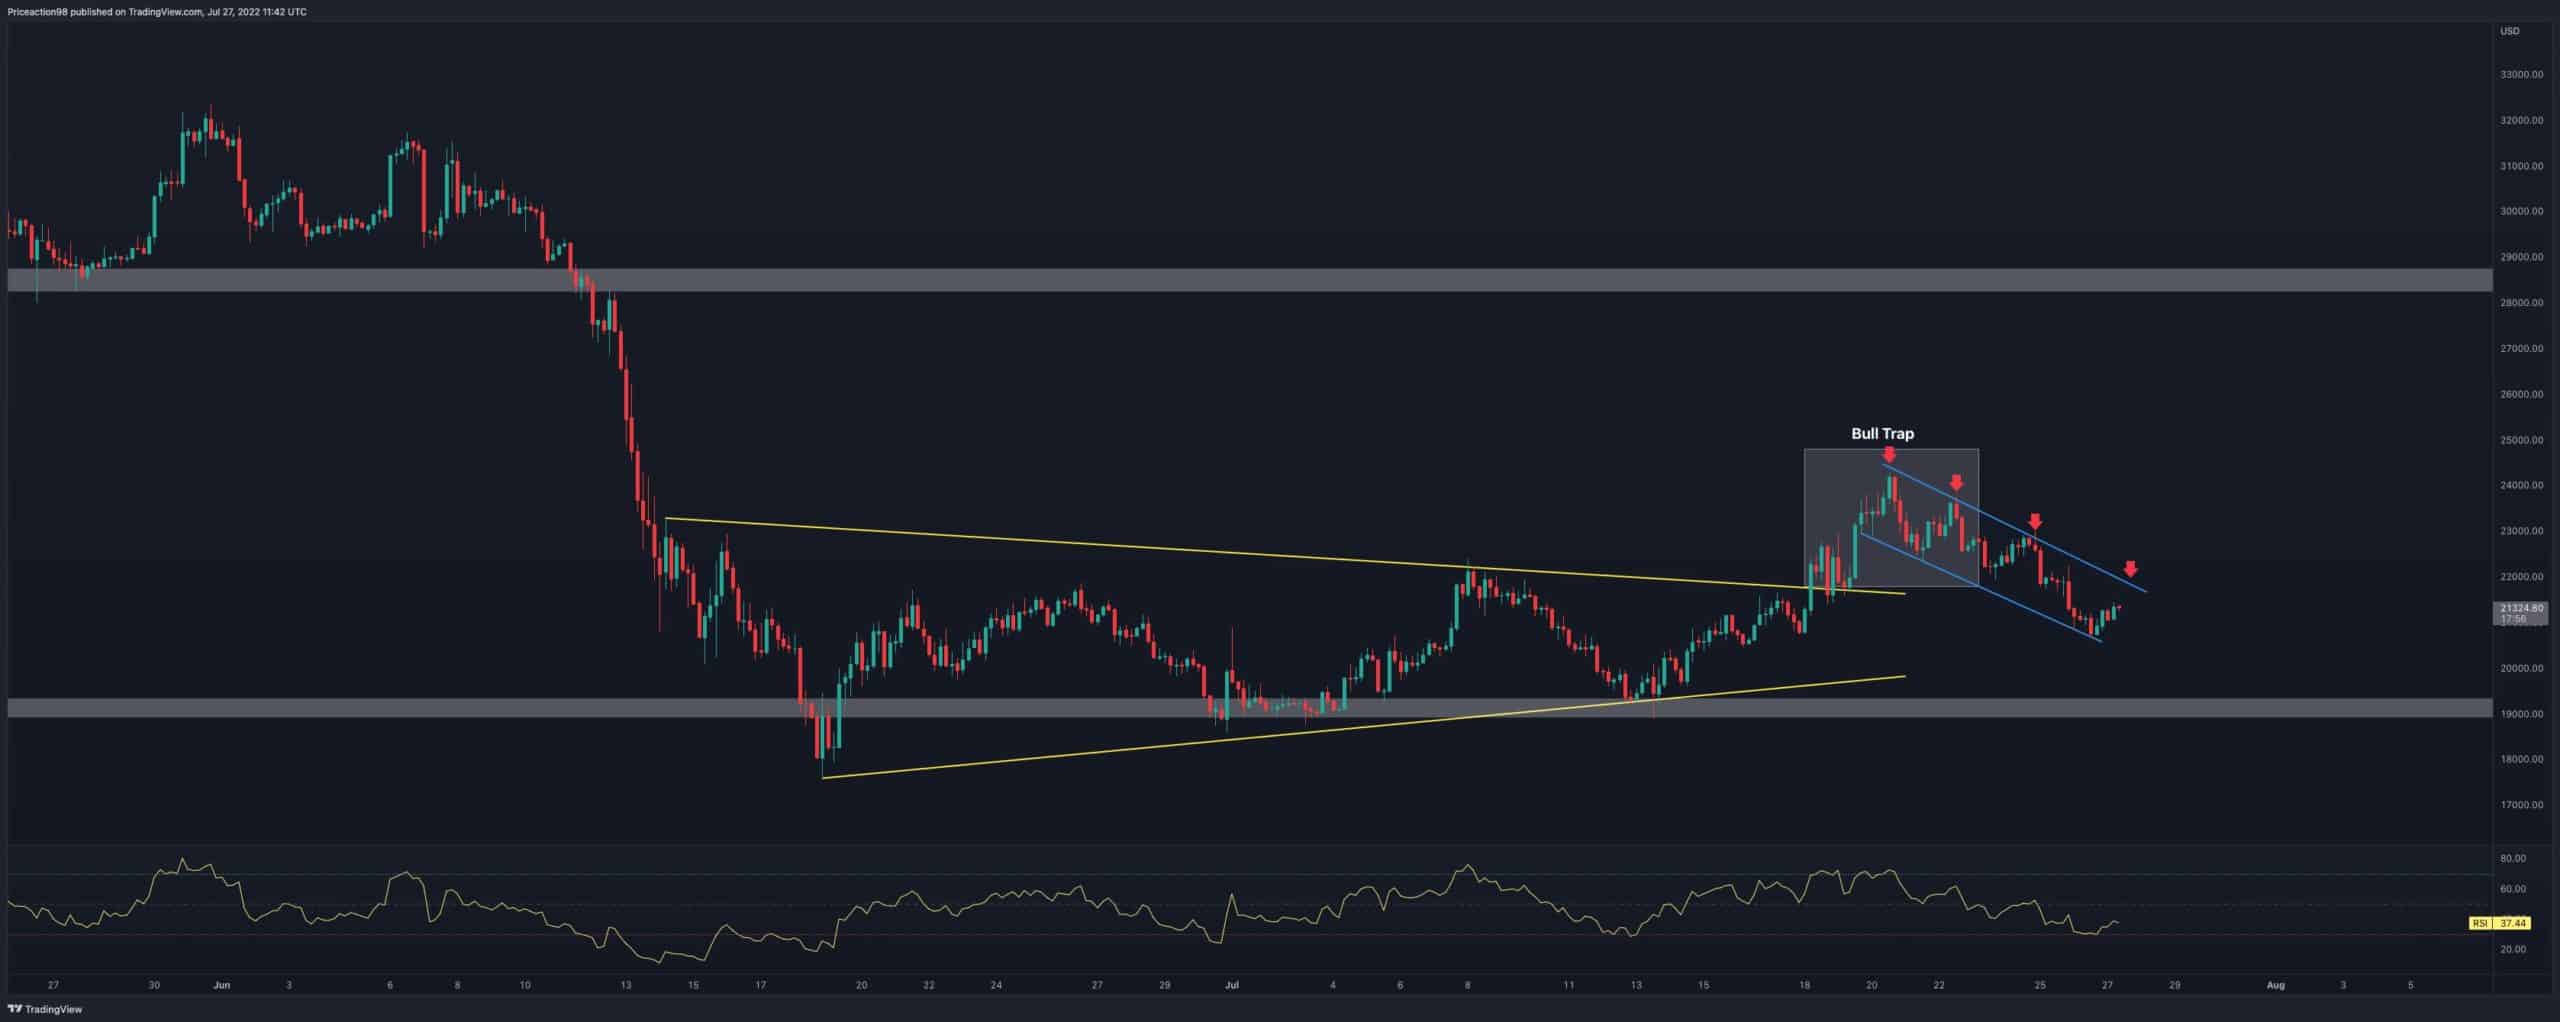
4 valandų diagrama
After experiencing a bearish expansion move a few weeks ago, Bitcoin had formed a well-known wedge price action pattern. On the other hand, the $19K level has served as excellent support and initiated a new bullish rally. However, after breaking the wedge’s upper trendline and forming a pullback, the bulls overcame the bears, and BTC experienced another rally.
The rally turns out to be an effective bull trap, the price has plummeted since then. Considering this bull trap and the price action, Bitcoin seems likely to experience another leg down to retest the $19K. If the $19K significant support level fails to hold the price, Bitcoin’s next destination will be the $16K mark.
Onchain analizė
Miners Fee to Reward Ratio calculates the percentage of the fee in the total block reward. Typically, during a bull run, this indicator spikes and indicates higher values, which demonstrate greater miner incentive to mine Bitcoin and more network activity, a sign of a healthy bull market.
In contrast, the indicator drops significantly during bear markets, almost close to zero, which shows capitulation. However, the metric experienced a steady rise at the end of the bearish cycles, a sign of accumulation among market participants.
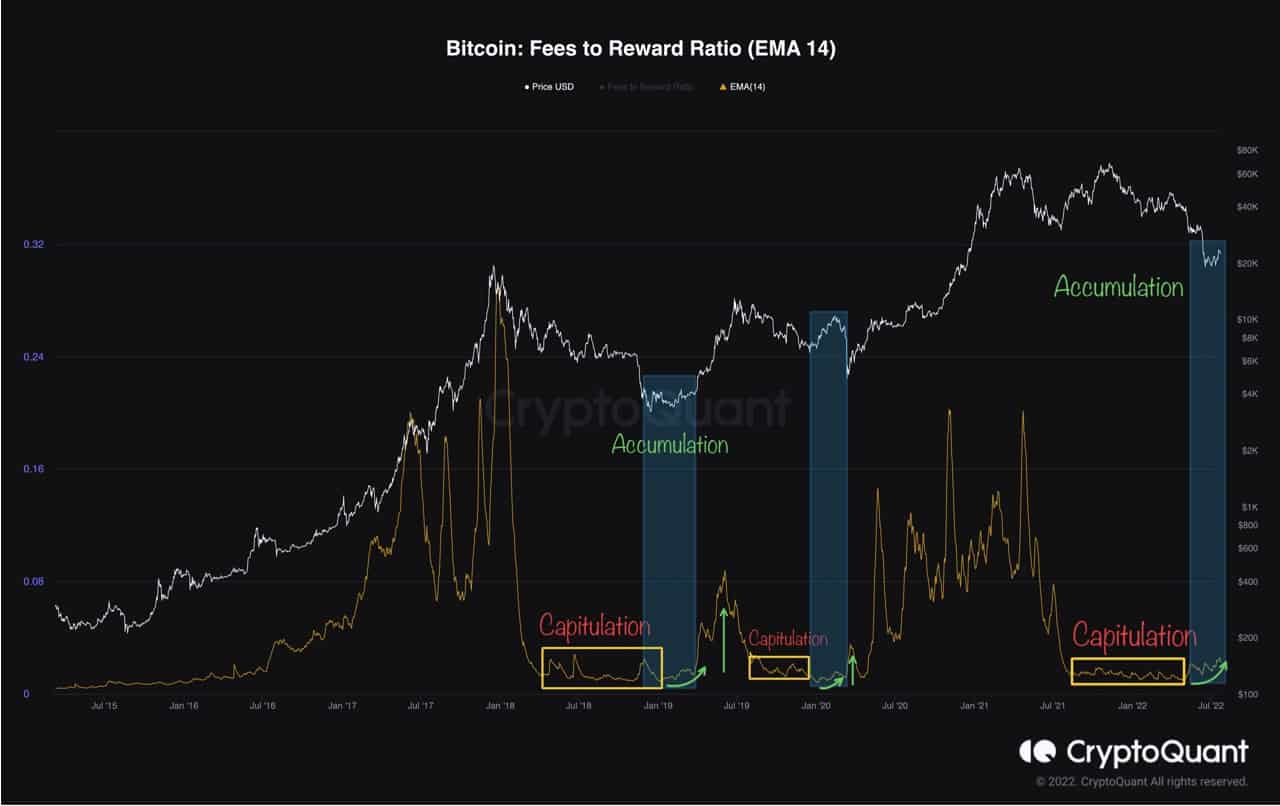
As a result, Bitcoin has always experienced a surge and initiated the next bullish cycle after the accumulation. Currently, the metric has dropped to zero after BTC experienced a 75% decline in its price and is rising slowly.
„Binance Free“ 100 USD (išskirtinis): Naudokite šią nuorodą užsiregistruoti ir gauti 100 USD nemokamą ir 10% nuolaidą „Binance Futures“ pirmajam mėnesiui (sąlygos).
Specialus „PrimeXBT“ pasiūlymas: Naudokite šią nuorodą užsiregistruoti ir įvesti POTATO50 kodą, kad gautumėte iki 7,000 USD už savo indėlius.
Atsisakymas: „CryptoPotato“ randama informacija, kurią cituoja rašytojai. Tai neatspindi „CryptoPotato“ nuomonės, ar pirkti, parduoti ar laikyti investicijas. Prieš priimant bet kokius investicinius sprendimus, jums patariama atlikti savo tyrimus. Naudokite pateiktą informaciją savo rizika. Norėdami gauti daugiau informacijos, žr.
Kriptovaliutų diagramos pateikė „TradingView“.
Source: https://cryptopotato.com/is-another-19k-retest-inbound-for-btc-bitcoin-price-analysis/