
„CryptoSlate“ grandinės „Glassnode“ metrikos analizė parodė skirtingus „Bitcoin“ dugno rezultatus.
Ankstesnis tyrimas, paskelbtas Rugsėjis 27 pažvelgė į pelno procentinio pasiūlos (PSP), rinkos vertės iki realizuotos vertės (MVRV) ir pelno ir nuostolių pasiūlos (SPL) metrikas, kurios visos rodė, kad tuo metu formuojasi dugnas.
Peržiūrėjus tuos pačius rodiklius, buvo pastebėta, kad PSP ir MVRV vis dar rodo dugną, tačiau SPL neberodo.
Bitcoin adresų pelno procentas
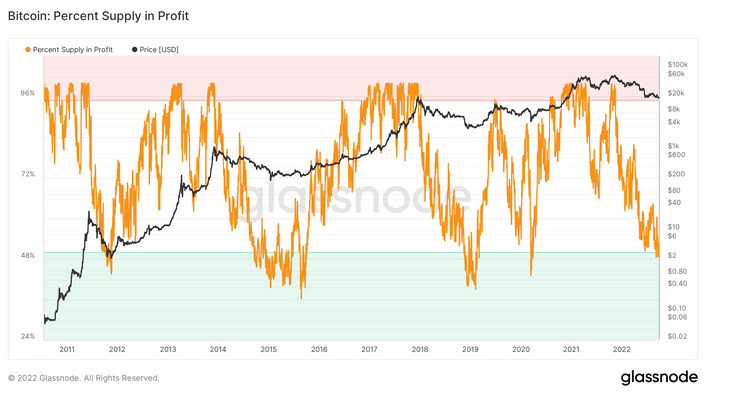
The Bitcoin: Percent Supply in Profit (PSP) metric refers to the proportion of unique BTC addresses with an average buy price lower than the current price.
During bear markets, the percentage of Bitcoin addresses in profit had always dropped below 50%. Moving back above this threshold generally coincided with bullish price movements.

The chart below, which dates back to 2010, shows a current reading below 50%, suggesting a bottoming is on the cards.
However, analysis shows the percentage of BTC supply in profit dipping much lower than 50% in the past, with profitable addresses sinking as low as 30% in 2015, this being the most extreme example on record.
2015 was an irregular period, recording multiple swings above and below the 50% threshold before a decisive PSP breakout towards the end of the year. This corresponded with BTC recapturing $1,000.
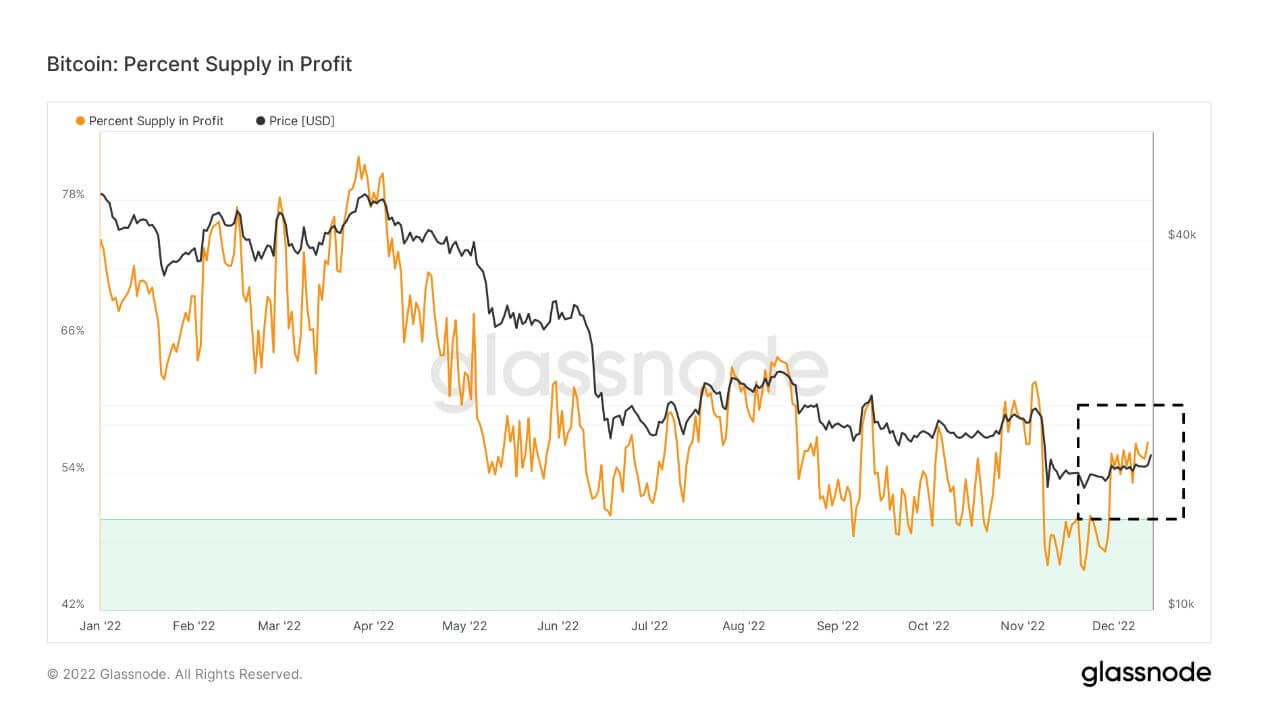
Zooming in on 2022’s movement shows PSP dipping below the 50% threshold yet crossing back above it in December.
A decisive break above the previous local top of around 60% could signal a price reversal. However, the alternative scenario may be a repeat of 2015, with choppiness around the threshold, a drop to lower PSP levels, and sell pressure being the dominant factor.
Rinkos vertė – realizuota vertė
Rinkos vertė ir realizuota vertė (MVRV) reiškia rinkos viršutinės ribos (arba rinkos vertės) ir realizuotos ribos (arba saugomos vertės) santykį. Palygindama šią informaciją, MVRV nurodo, kada Bitcoin kaina viršija arba mažesnė už tikrąją vertę.
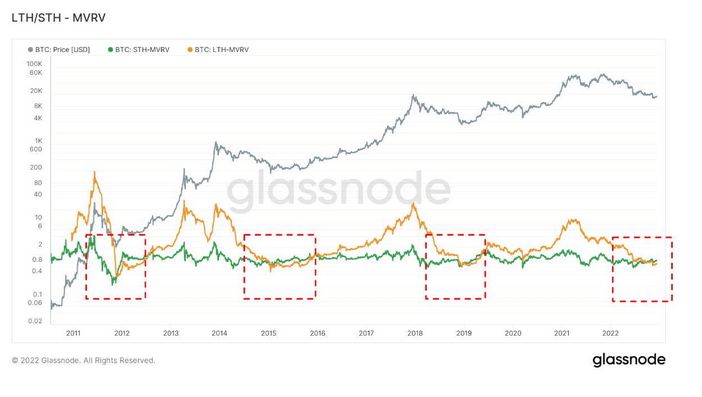
MVRV is further split by long-term and short-term holders, with Long-Term Holder MVRV (LTH-MVRV) referring to unspent transaction outputs with a lifespan of at least 155 days and Short-Term Holder MVRV (STH-MVRV) equating to unspent transaction lifespans of 154 days and below.
Previous cycle bottoms were characterized by a convergence of the STH-MVRV and LTH-MVRV lines, with the former crossing above the latter to signal a bullish reversal in price.
The STH-MVRV moving above the LTH-MVRV was noted on Sep. 27’s research report. An updated chart shows this pattern holding at present, suggesting a bottoming is still in the offing.
Pasiūla pelno (nuostolio) ataskaitoje
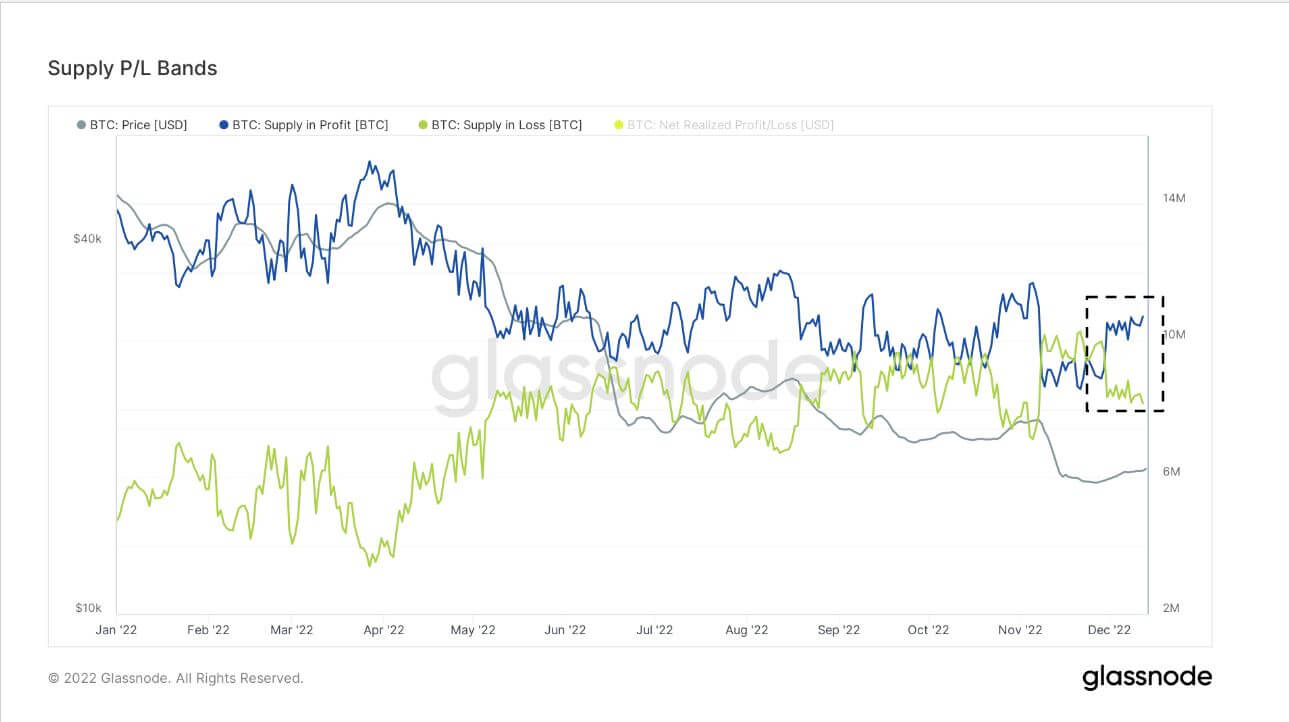
Analizuojant BTC žetonų, kurių kaina buvo mažesnė arba didesnė už dabartinę kainą paskutinį kartą perkeliant, skaičių, Pelno ir nuostolio (SPL) metrika parodo cirkuliuojančią pasiūlą pelno ir nuostolio pavidalu.
Market cycle bottoms coincide with the Supply in Profit (SP) and Supply in Loss (SL) lines converging. Price reversals occur when the SL line crosses above the SP line. Currently, a convergence of SP and SL has happened.
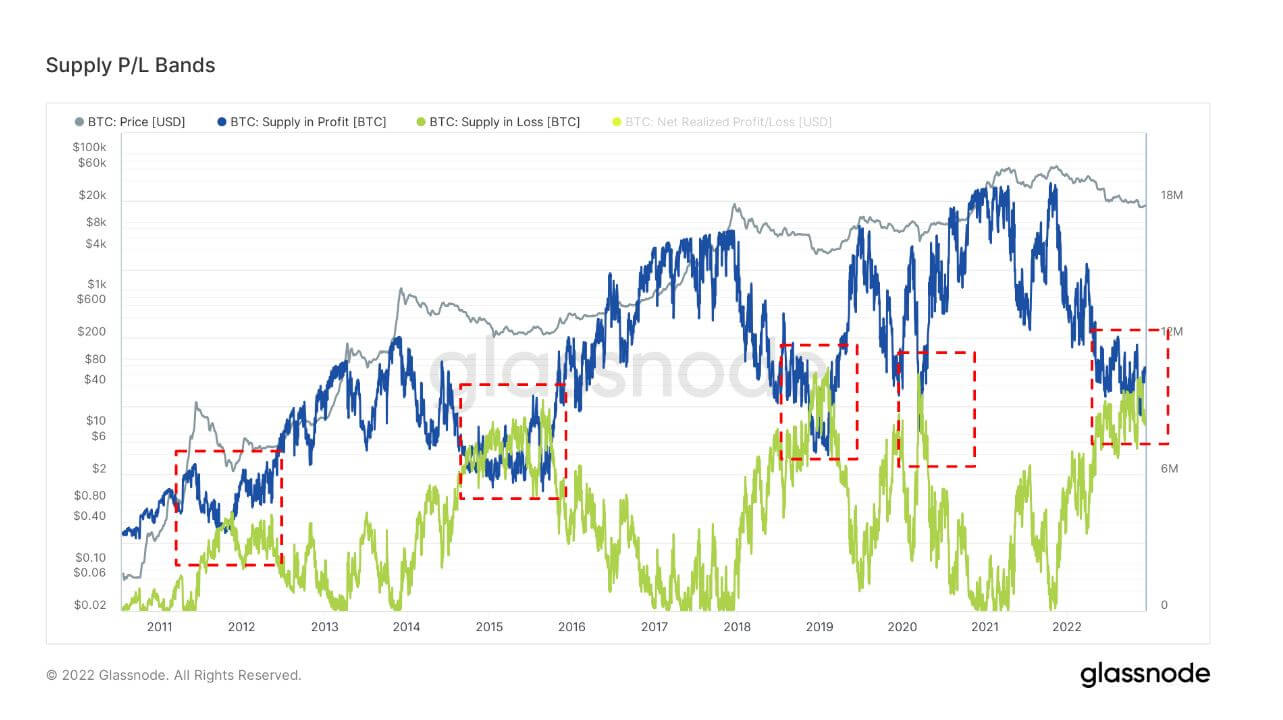
Analyzing this on a zoomed-in timeframe for 2022 shows convergence occurring around September, indicating a bottoming playing out. However, since December, the SP and SL lines have diverged significantly, thus invalidating a bottoming.
Source: https://cryptoslate.com/on-chain-bitcoin-metrics-show-the-bottom-may-not-be-in/