Ethereum has spent the last four weeks on a bullish footing as the buyers managed to shoot the price up from around $1,000. The bears were waiting around the overhead resistance at $1,800. They have prevented further price increases twice thus far, so is it time for the bulls to rest?
Techninė analizė
Autorius: Pražilęs
Dienos diagrama
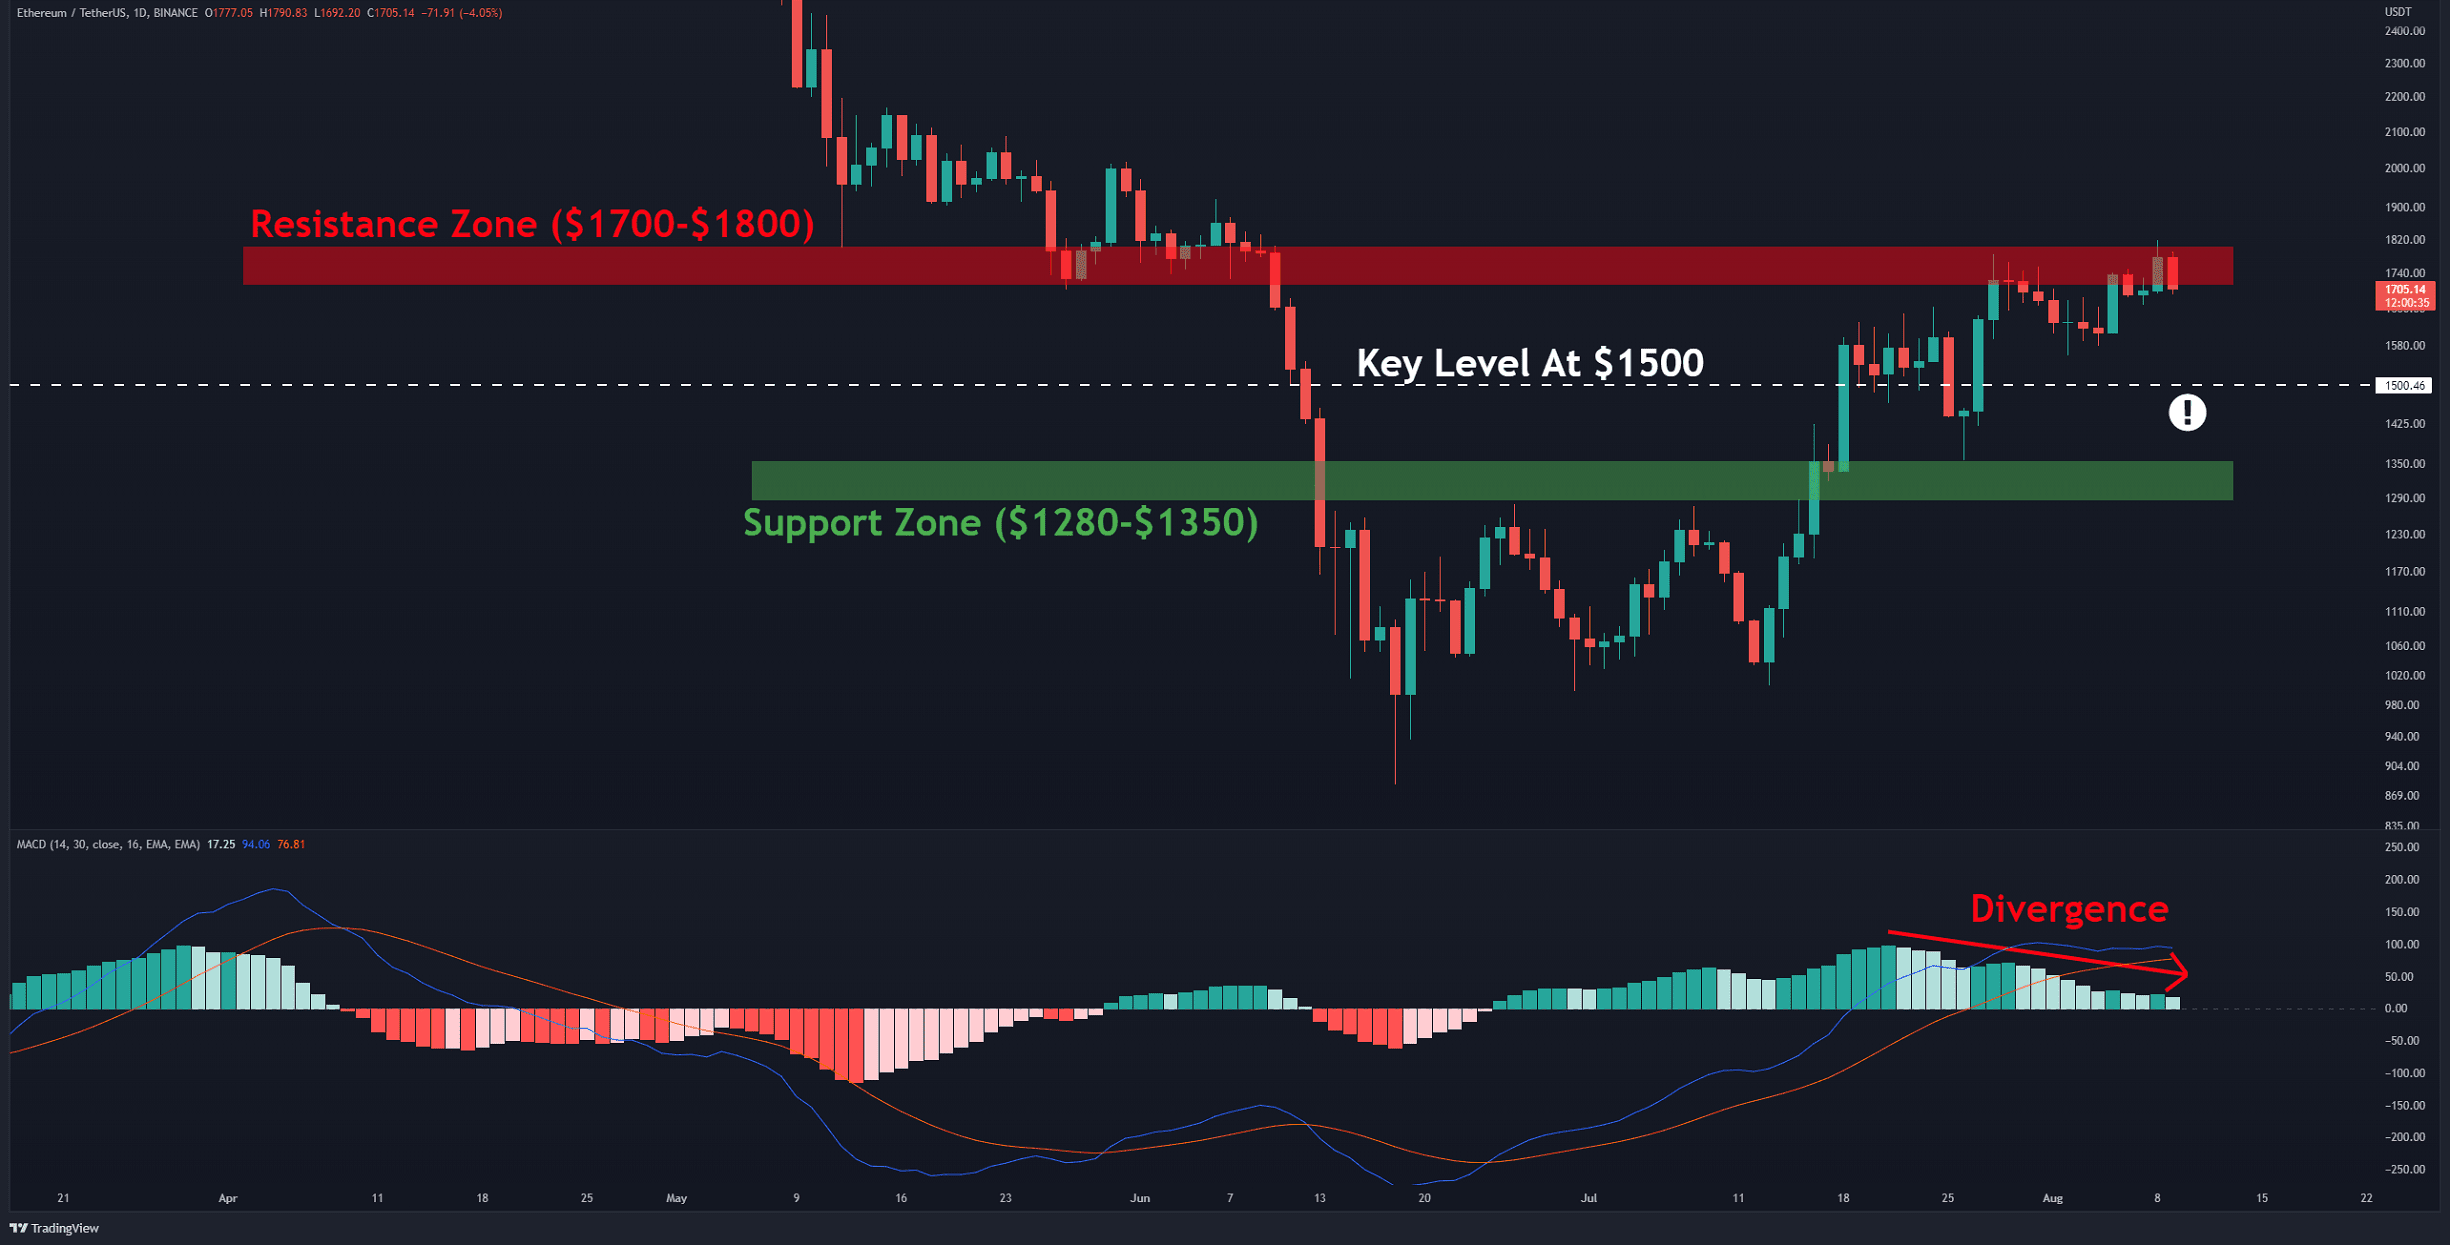
Yesterday, the bulls managed to briefly push the price above $1,800, but that’s where bears interfered. As a result, the cryptocurrency has fallen 6% as of this writing. The Moving Average Convergence Divergence (MACD) has shown negative divergence for some time, which is not good. Resuming the uptrend requires a break and close above the resistance zone at $1700-$1800 (in red).
On the other hand, if the bulls cannot clear this hurdle the bearish momentum may prompt the cryptocurrency to reach $1,500. A break below this level suggests that the bullish momentum has weakened. In this scenario, retesting the support zone in the range of $1,280-1,350 (in green) will look more likely.

Pagrindiniai palaikymo lygiai: 1500 USD ir 1350 USD
Pagrindiniai pasipriešinimo lygiai: 1800 USD ir 2160 USD
Dienos slenkantys vidurkiai:
MA20: 1635 USD
MA50: 1374 USD
MA100: 1636 USD
MA200: 2269 USD
ETH/BTC diagrama
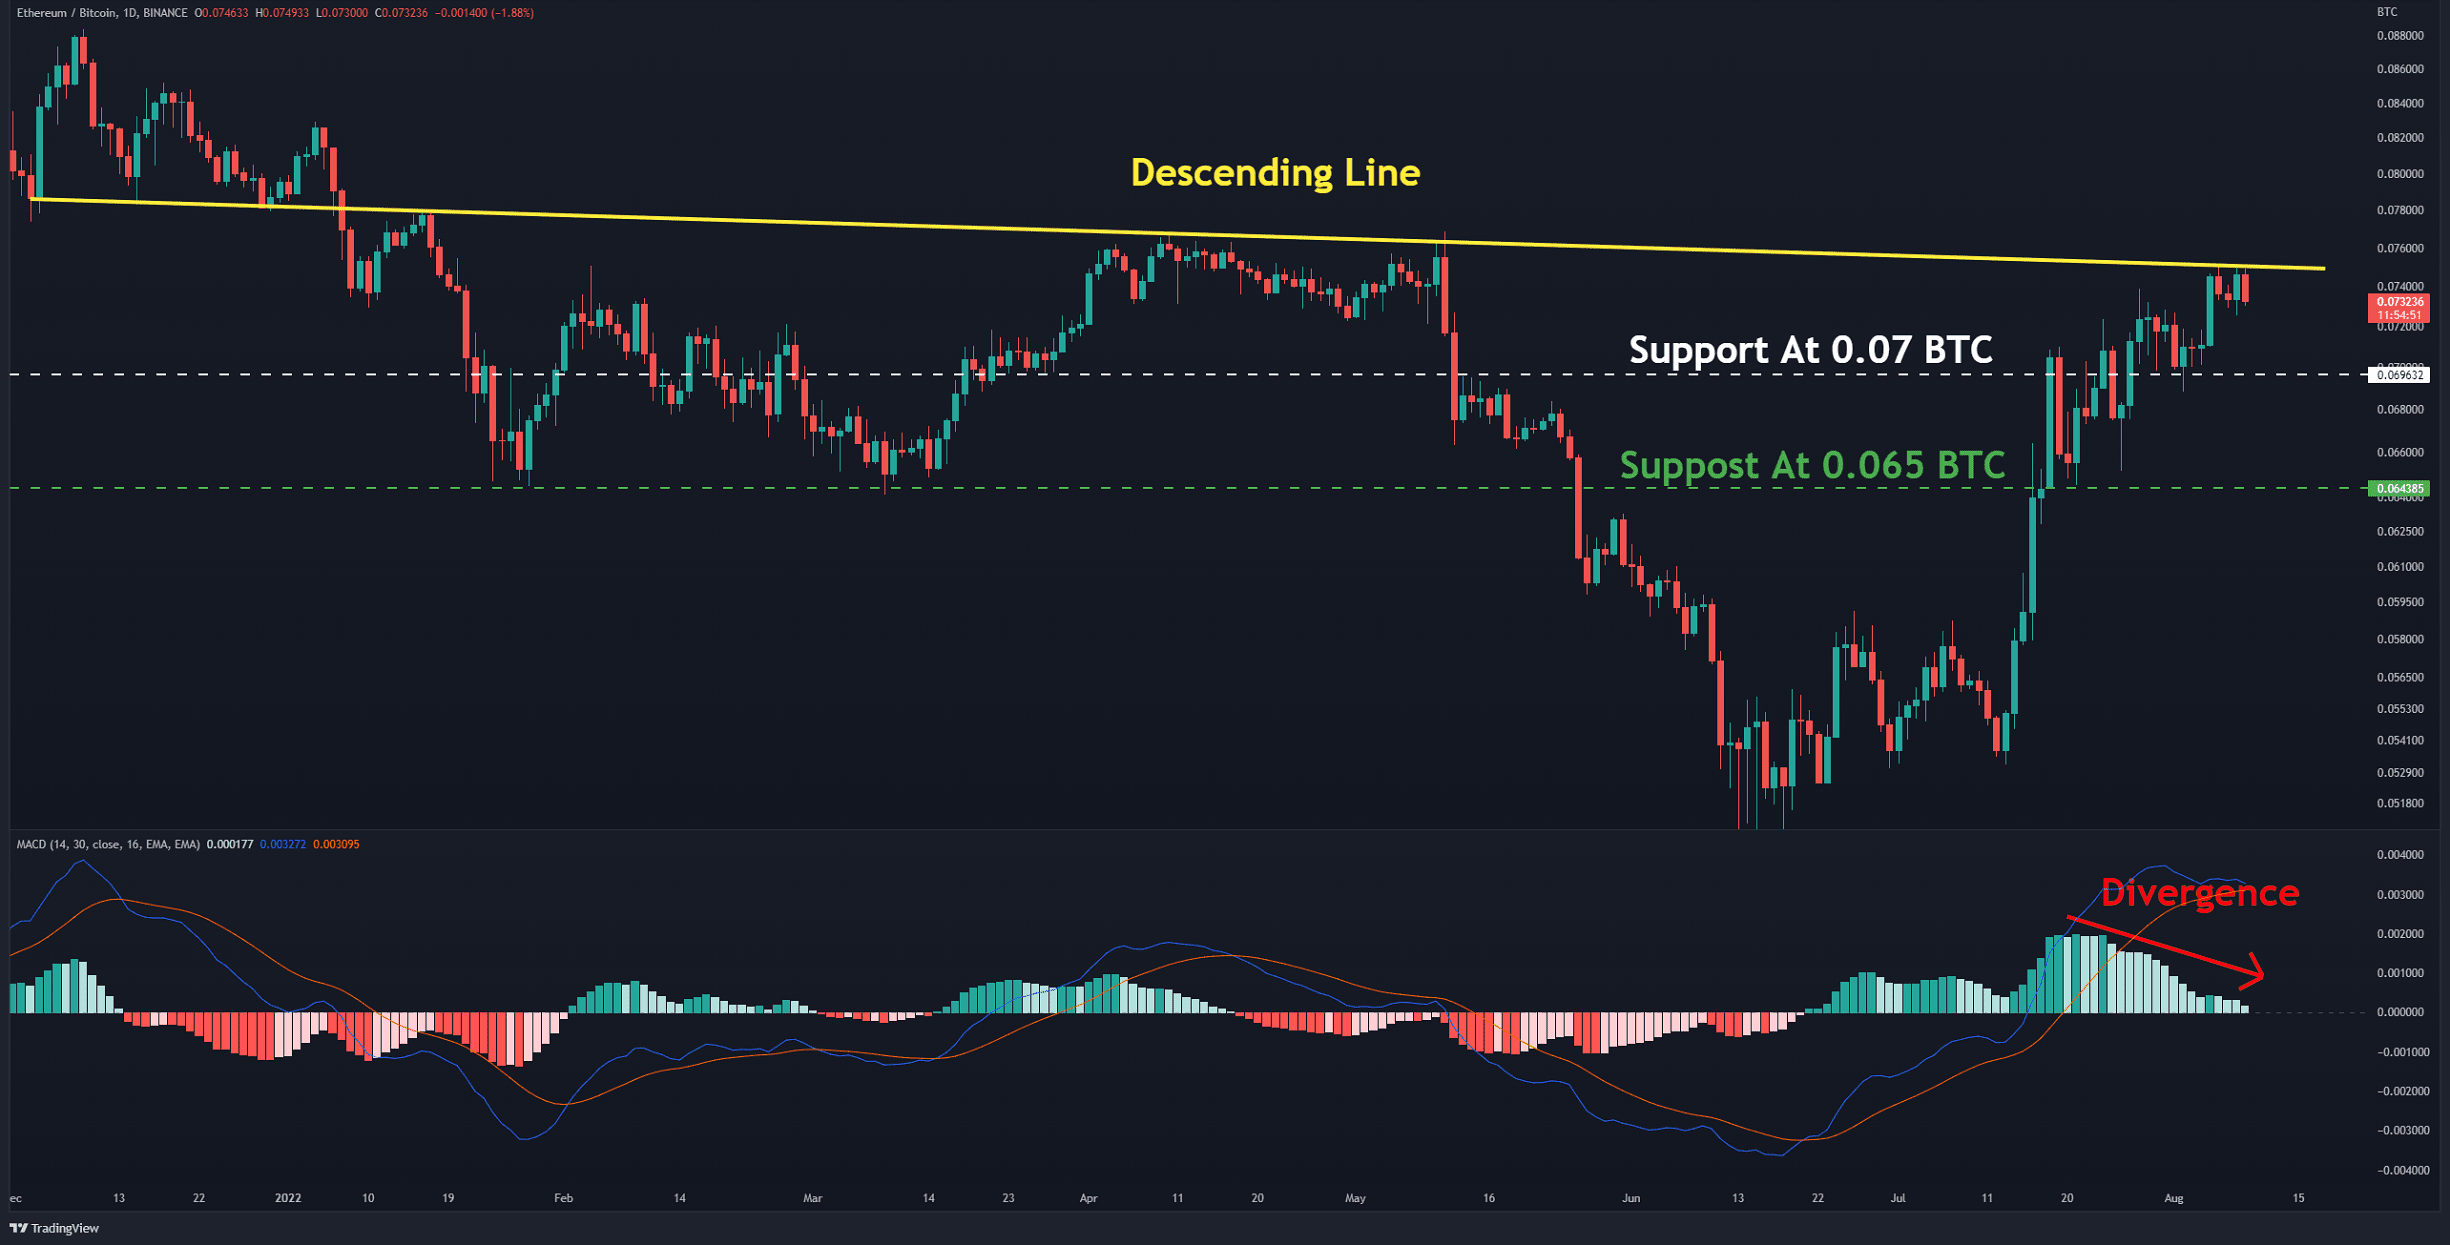
The bullish momentum against BTC seems to be waning. The divergence in the MACD indicator is clear. Bulls probably need to rest after breaking several firm resistances and reaching the descending line resistance (in yellow). The positive structure would remain strong as long as the bulls hold prices above 0.065 BTC (in green). If the horizontal support at 0.07 BTC (in white) cracks, the downtrend will likely be triggered. A close below 0.065 BTC signals the formation of a bearish structure.
Pagrindiniai palaikymo lygiai: 0.07 ir 0.065 BTC
Pagrindiniai pasipriešinimo lygiai: 0.075 ir 0.08 BTC
Grandinės analizė
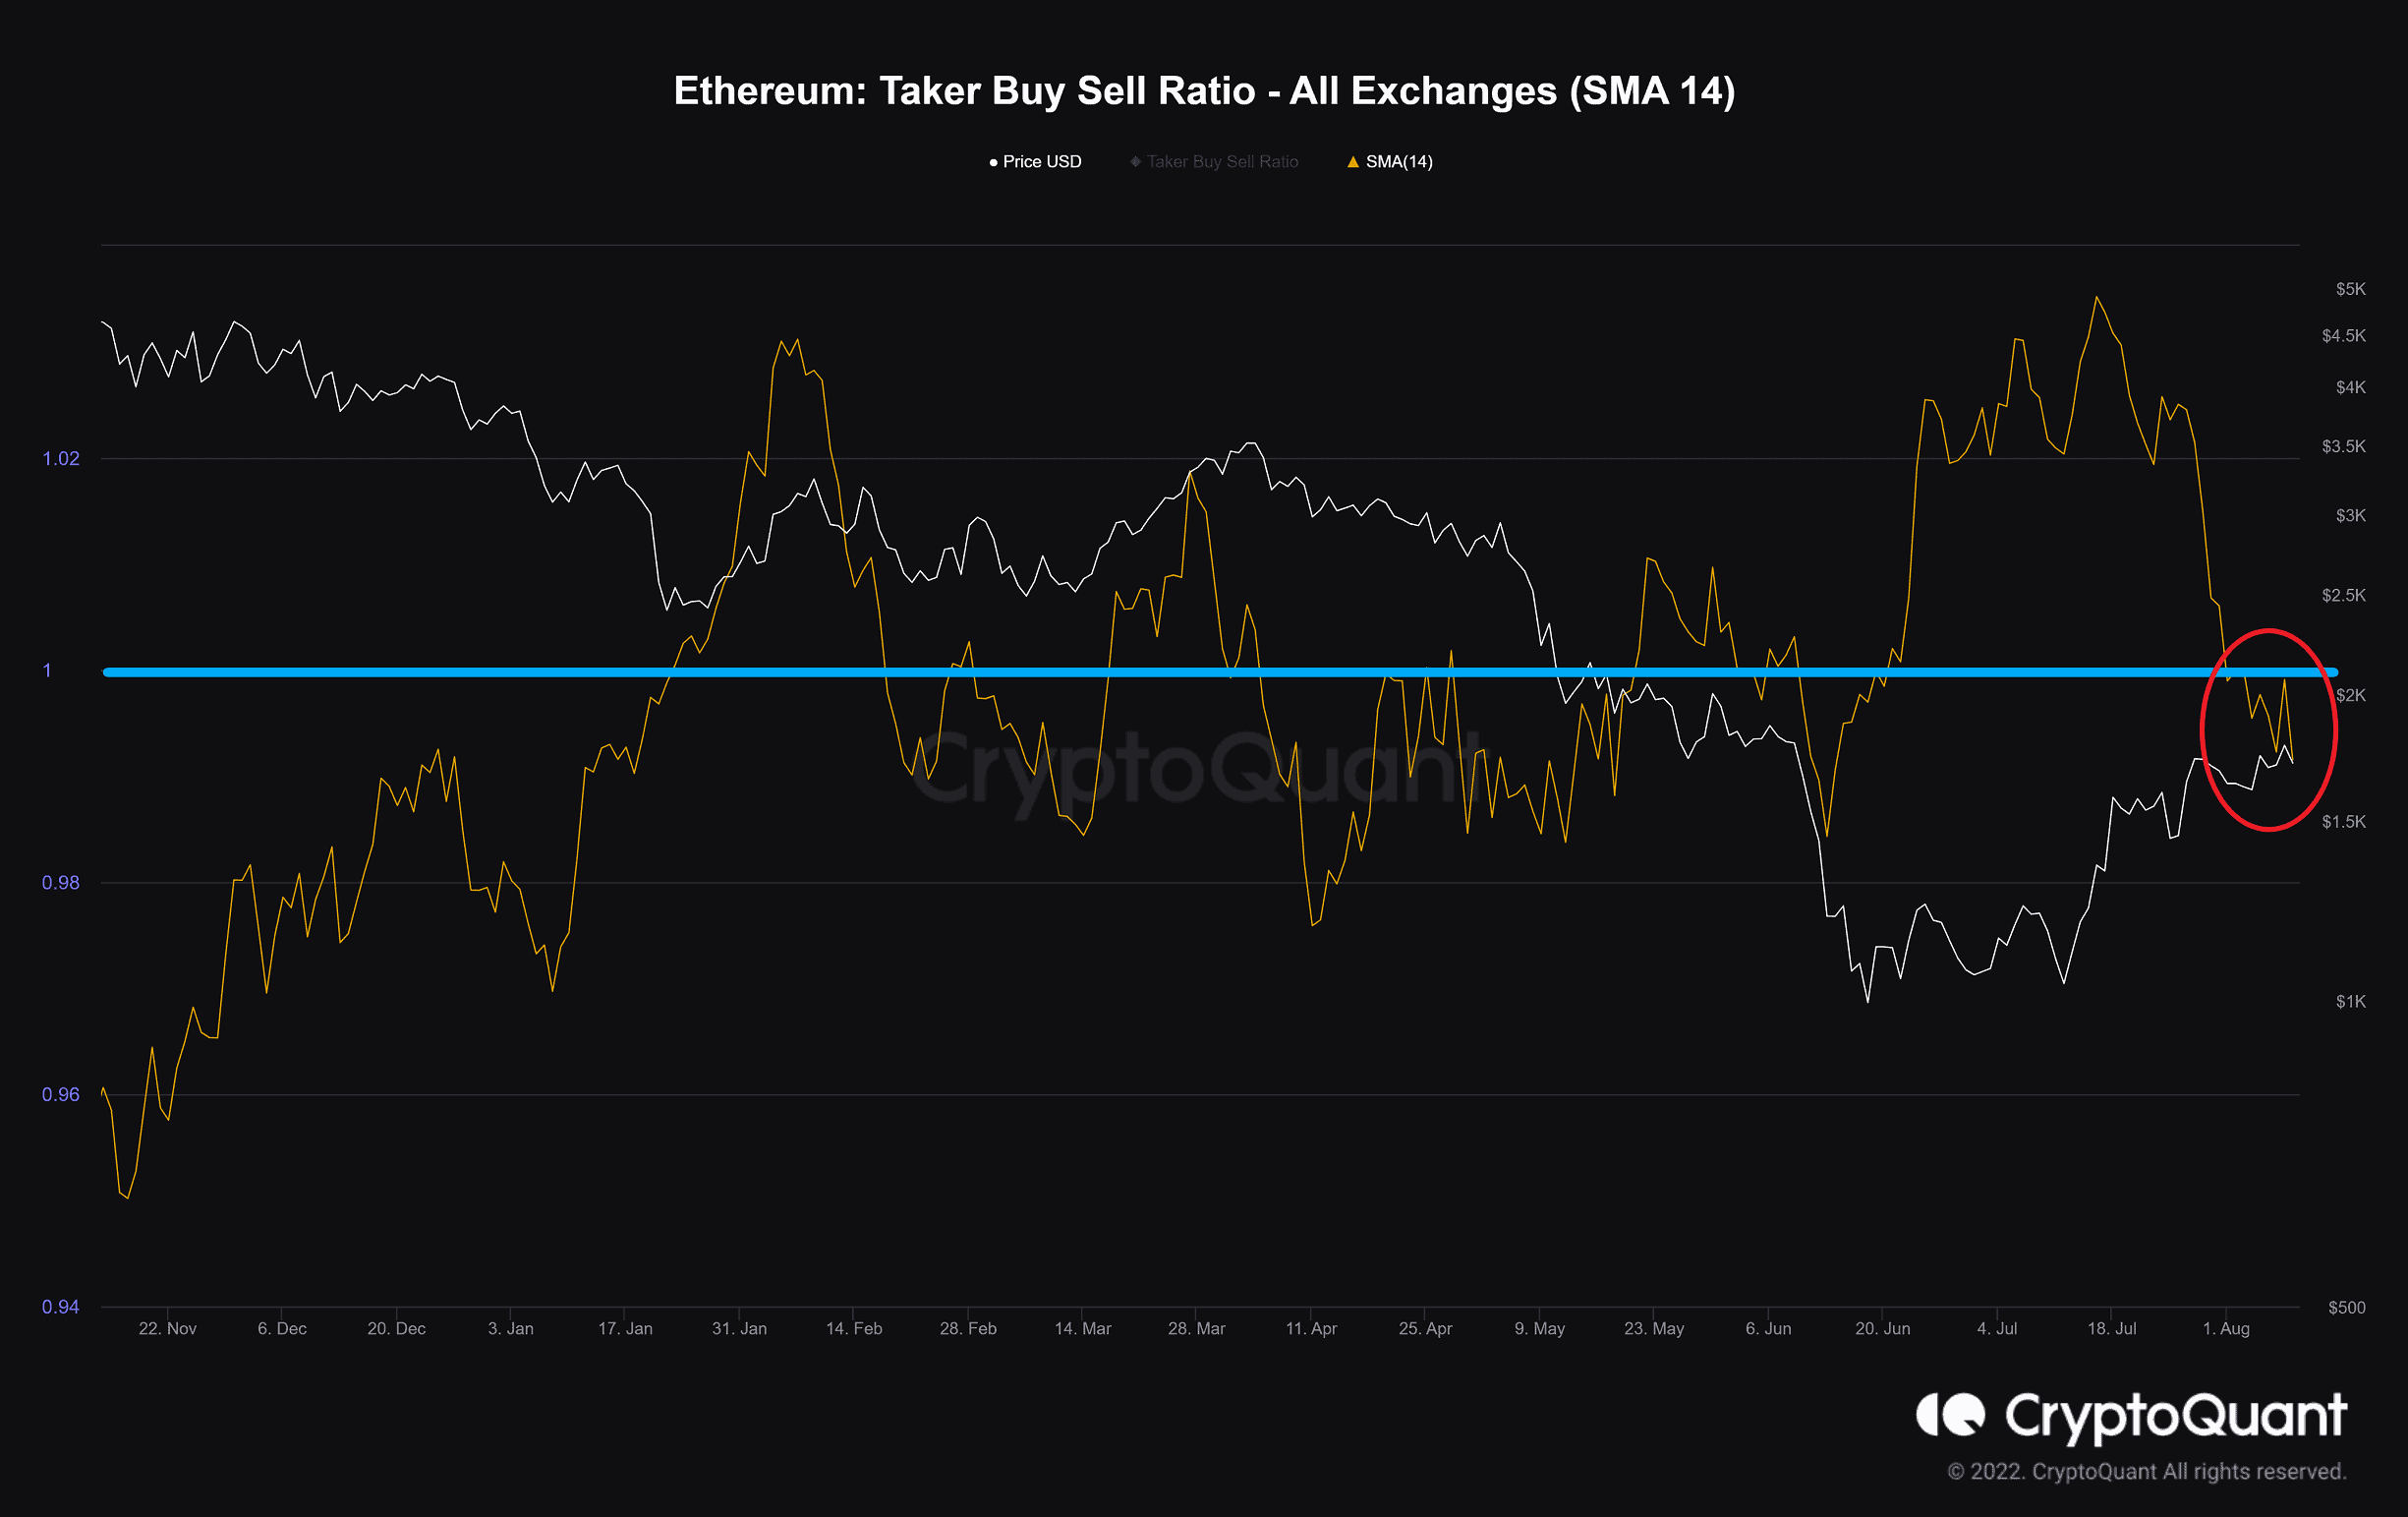
Imtojo pirkimo pardavimo santykis
Apibrėžimas: Pirkimo apimties santykis, padalytas iš pirkėjų pardavimo apimties perpetual swap sandoriuose.
Reikšmės, didesnės nei 1, rodo, kad dominuoja bulių nuotaikos.
Vertės, mažesnės nei 1, rodo, kad dominuoja meškų nuotaikos.
According to CryptoQuant data, takers fill more sell orders in the derivatives market. This makes the bearish sentiment prevail for the time being. This metric ideally must stay below 1 (light blue line), so it’s important to remain very cautious.
„Binance Free“ 100 USD (išskirtinis): Naudokite šią nuorodą užsiregistruoti ir gauti 100 USD nemokamą ir 10% nuolaidą „Binance Futures“ pirmajam mėnesiui (sąlygos).
Specialus „PrimeXBT“ pasiūlymas: Naudokite šią nuorodą užsiregistruoti ir įvesti POTATO50 kodą, kad gautumėte iki 7,000 USD už savo indėlius.
Atsisakymas: „CryptoPotato“ randama informacija, kurią cituoja rašytojai. Tai neatspindi „CryptoPotato“ nuomonės, ar pirkti, parduoti ar laikyti investicijas. Prieš priimant bet kokius investicinius sprendimus, jums patariama atlikti savo tyrimus. Naudokite pateiktą informaciją savo rizika. Norėdami gauti daugiau informacijos, žr.
Kriptovaliutų diagramos pateikė „TradingView“.
Source: https://cryptopotato.com/eth-corrects-6-overnight-after-failing-to-overcome-1-8k-ethereum-price-analysis/