The bulls have dominated the market for the past few days. A 40% growth in 10 days can surely be interpreted positively, but it’s important to examine all scenarios.
Techninė analizė
By Pražilęs
Dienos diagrama
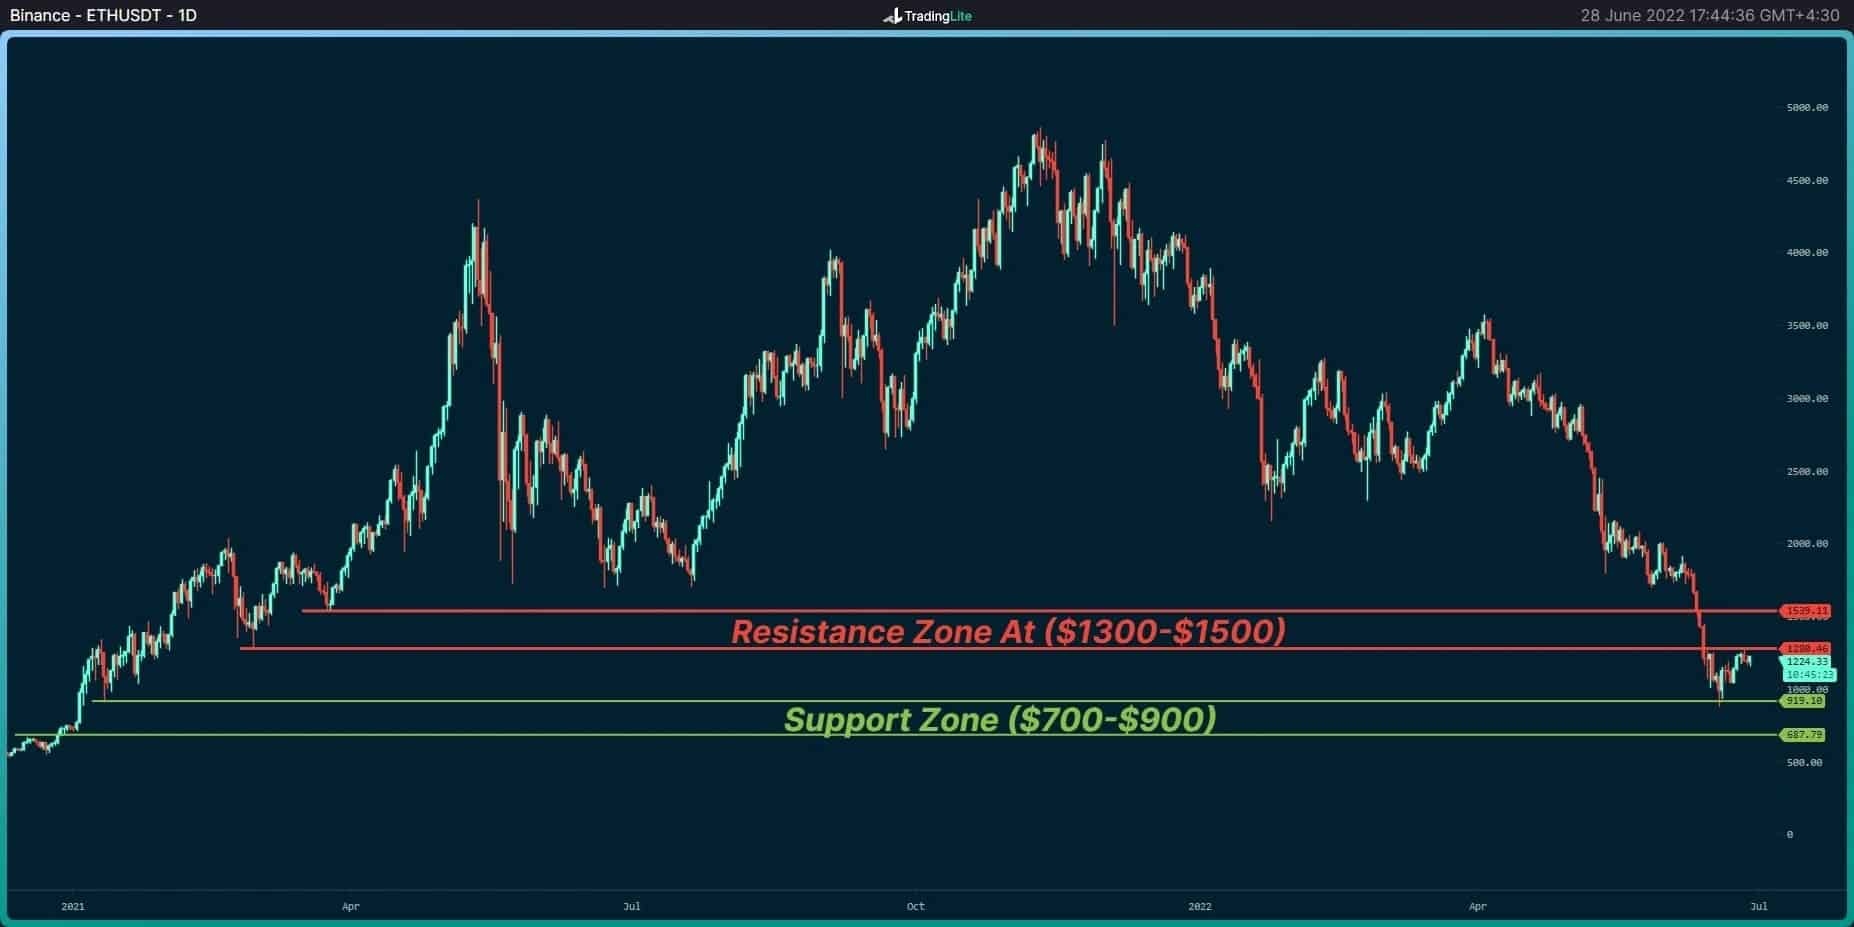
The price is currently stuck below the resistance zone on the daily time frame, as shown in the chart. This zone ranges from $1300 to $1500 (in red) and was expected to provide solid support during the sharp collapse earlier in June – which it obviously failed to do. Now, it’s acting as a serious resistance.
On the other hand, buyers have turned the range of $700 to $900 into a support zone (in green).

With this structure in place, one can expect the start of a relief rally if buyers can push the price above the horizontal resistance at $1500. Then the hopes for starting a rally are restored. No significant movement can be expected until the price fluctuates between the two zones marked on the chart. With this said, the most obvious catalyst remains the ETH 2.0 merge.
Pagrindiniai palaikymo lygiai: 900 USD ir 700 USD
Pagrindiniai pasipriešinimo lygiai: 1300 USD ir 1500 USD
Slankieji vidurkiai:
MA20: 1273 USD
MA50: 1680 USD
MA100: 2366 USD
MA200: 3037 USD
ETH/BTC diagrama
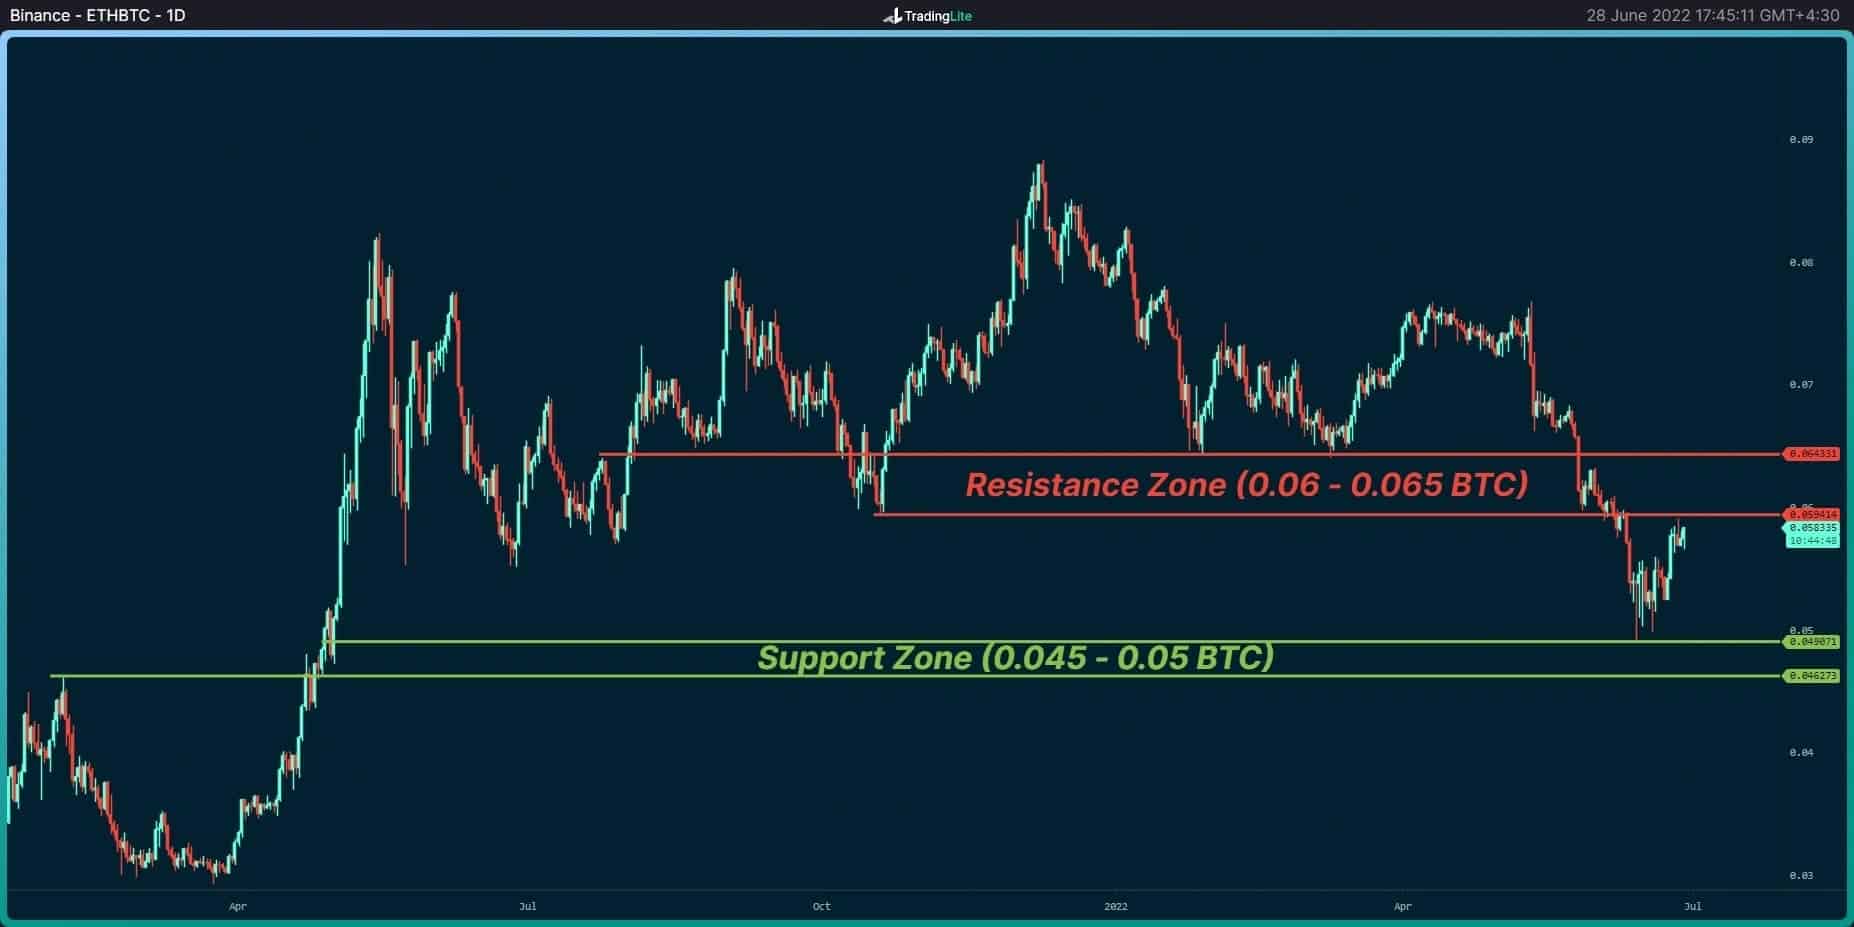
Interestingly, the situation against BTC is almost similar to the USD pair. The price is stuck below a resistance zone (in red) in this chart. Breaking this range is necessary to continue the upward trend. The bulls have established a temporary equilibrium over the last two weeks, and if the bears fail to take control of the market, the probability of a short-term rally rises accordingly.
Pagrindiniai palaikymo lygiai: 0.050 BTC ir 0.0.045 BTC
Pagrindiniai pasipriešinimo lygiai: 0.06 BTC ir 0.065 BTC
Open Interest Analysis
Apibrėžimas: Atidaryti palūkanas is defined as the number of open positions (including both long and short positions) currently on a derivative exchange’s trading pairs.
Increasing open interest (OI), more liquidity, and consequently – that speculation is coming to the derivative market. The increasing trend in OI could be a confirmation of the current ongoing macro price trend.
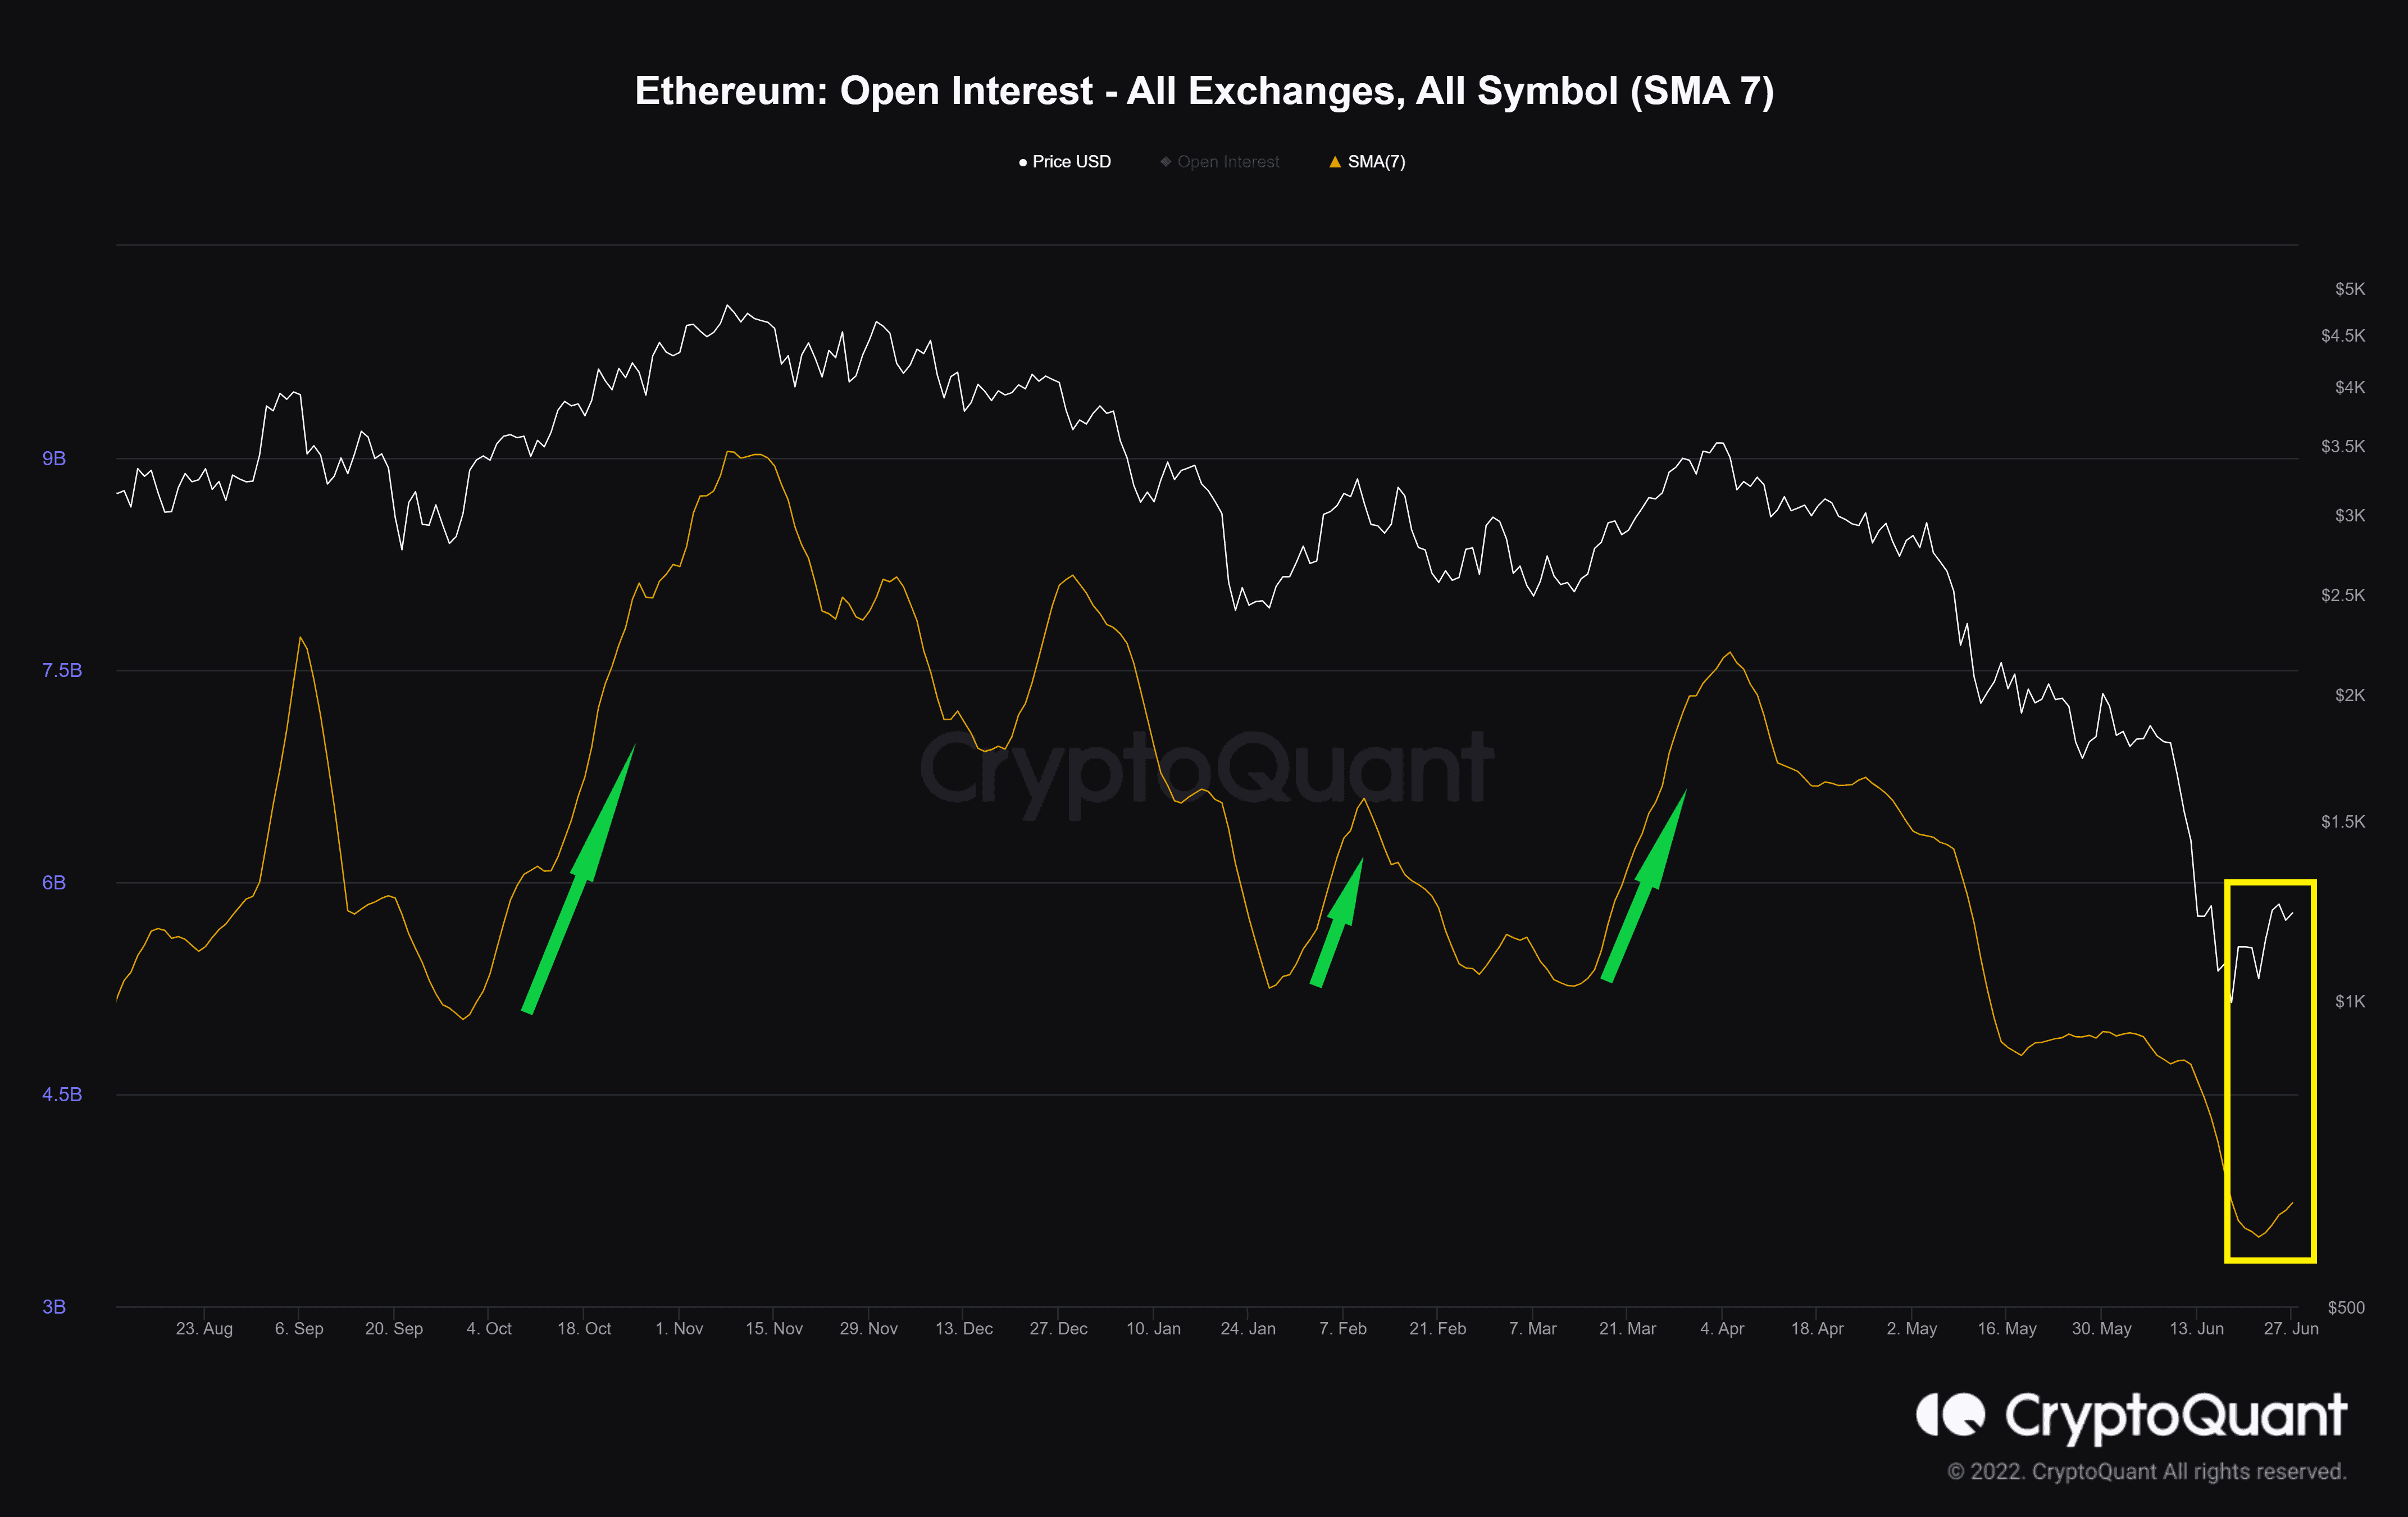
Uptrends have often been accompanied by rising open interest. This index, which has been on a downward trend since early April, has reached its lowest level in a year. Recently, an uptrend can be seen, but its lifespan isn’t extended enough to be considered a strong sign of liquidity entering the market.
„Binance Free“ 100 USD (išskirtinis): Naudokite šią nuorodą užsiregistruoti ir gauti 100 USD nemokamą ir 10% nuolaidą „Binance Futures“ pirmajam mėnesiui (sąlygos).
Specialus „PrimeXBT“ pasiūlymas: Naudokite šią nuorodą užsiregistruoti ir įvesti POTATO50 kodą, kad gautumėte iki 7,000 USD už savo indėlius.
Atsisakymas: „CryptoPotato“ randama informacija, kurią cituoja rašytojai. Tai neatspindi „CryptoPotato“ nuomonės, ar pirkti, parduoti ar laikyti investicijas. Prieš priimant bet kokius investicinius sprendimus, jums patariama atlikti savo tyrimus. Naudokite pateiktą informaciją savo rizika. Norėdami gauti daugiau informacijos, žr.
Kriptovaliutų diagramos pateikė „TradingView“.
Source: https://cryptopotato.com/eth-price-analysis-heres-the-level-ethereum-needs-to-break-to-extend-bullish-relief/