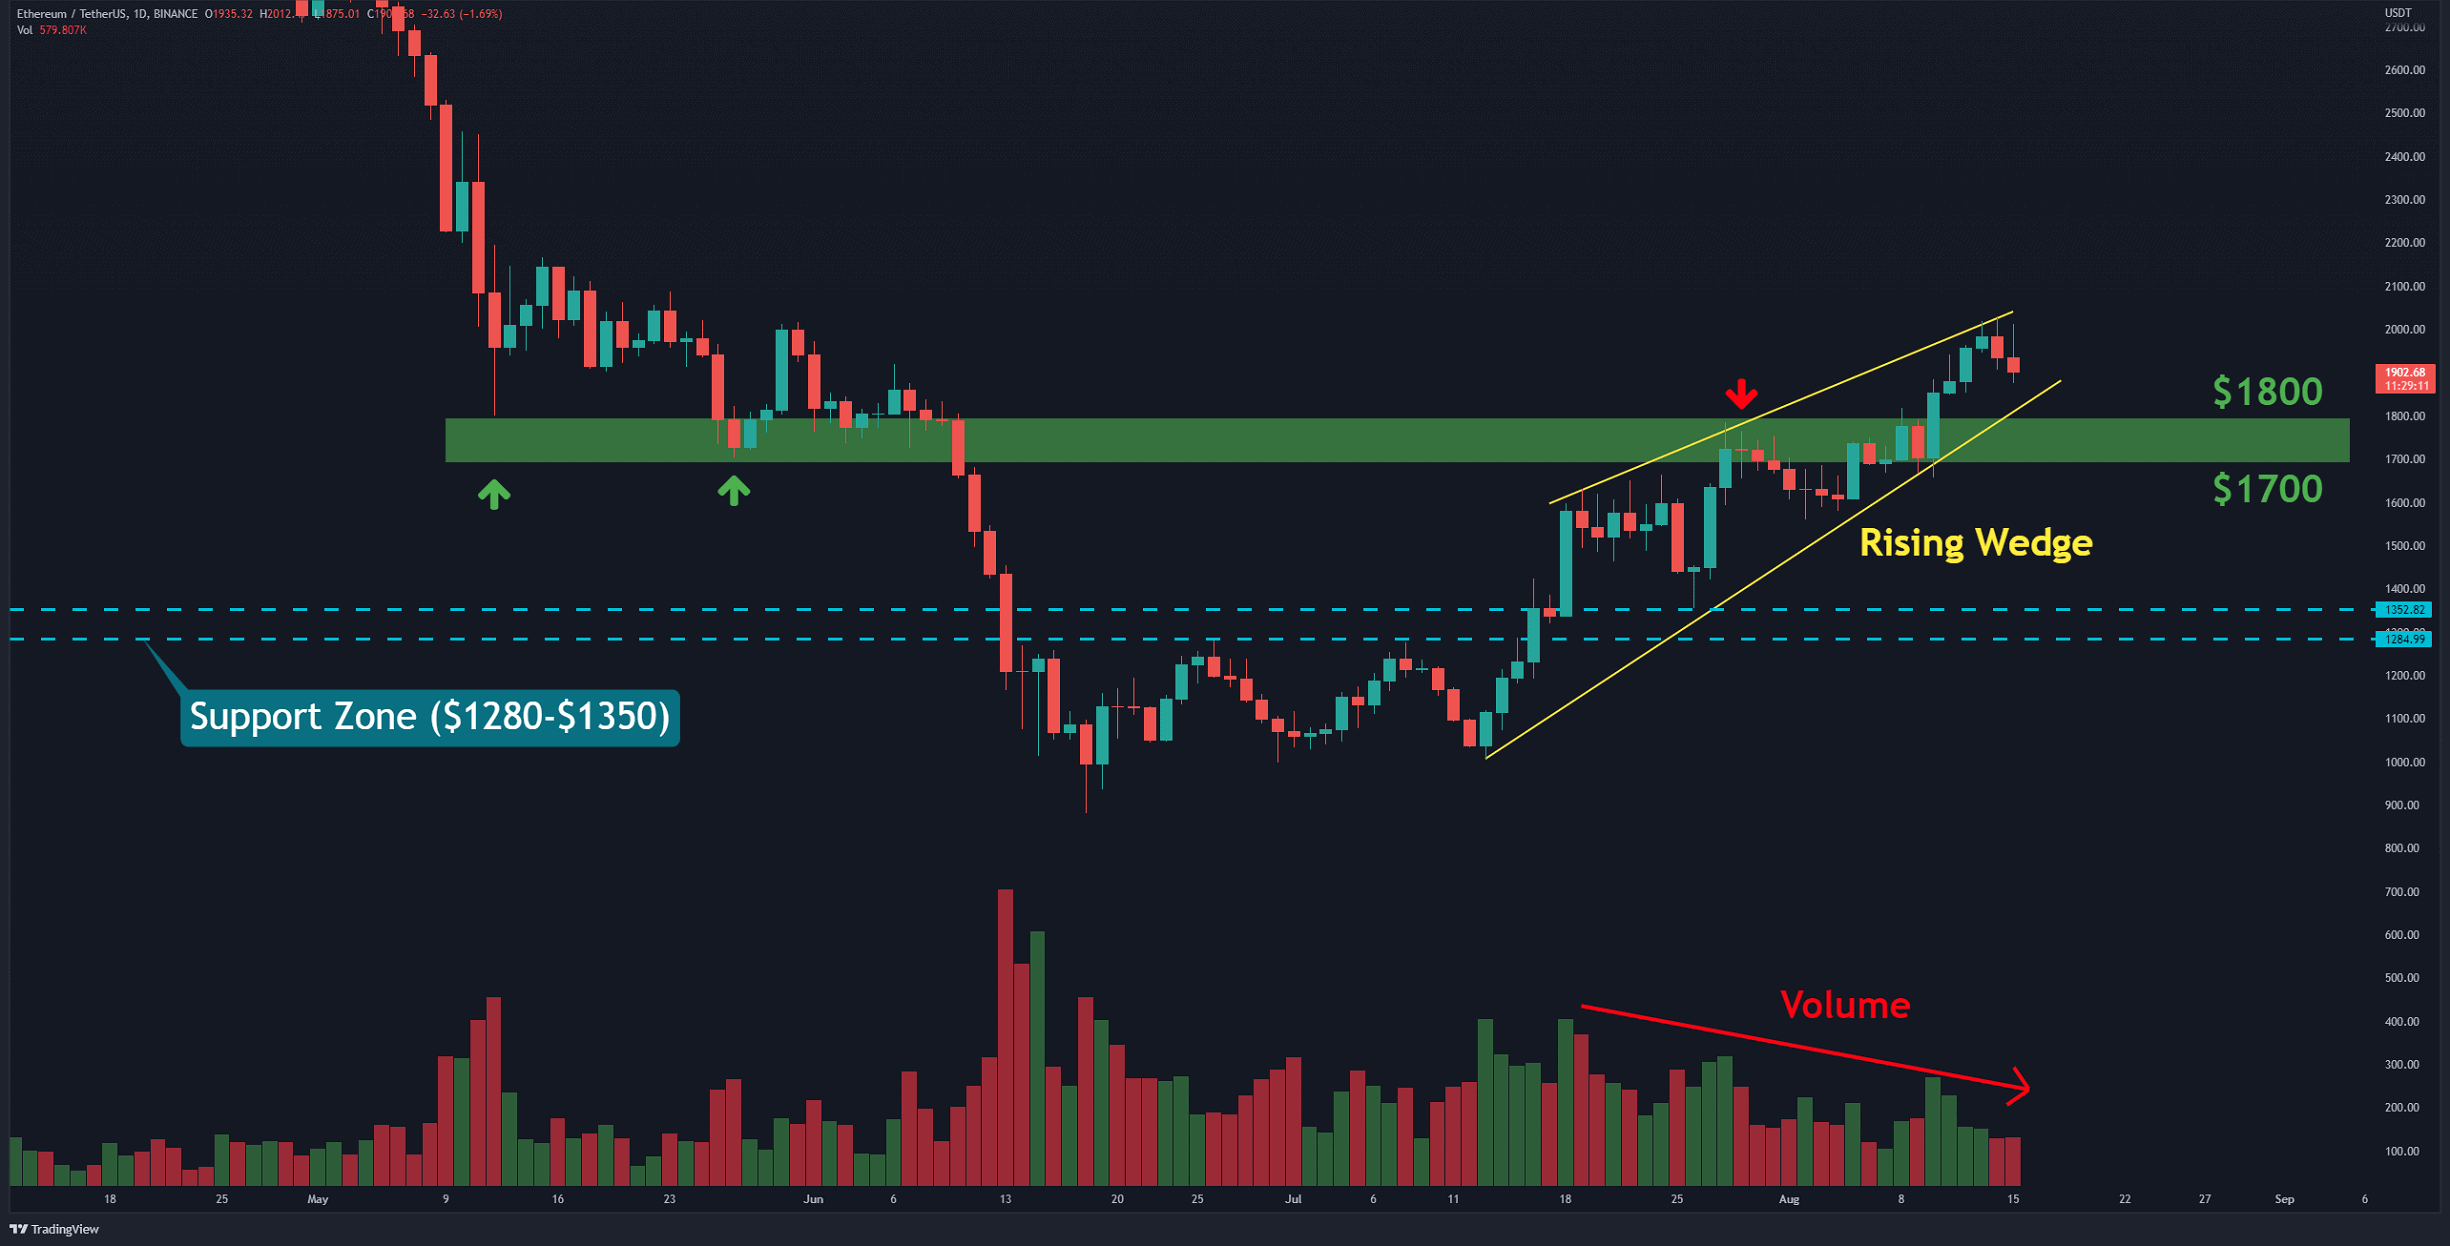
Ethereum has experienced a 6.6% correction from the daily high it recorded at $2012. The critical support level lies in the price range between $1700 and $1800, and it is very important for ETH to keep above it to prevent any further declines.
Techninė analizė
By Pražilęs
Dienos diagrama
Ethereum is moving along inside a rising wedge (in yellow), which is technically a bearish pattern. Simultaneously, the trading volume on Binance is decreasing. This suggests that buyers are gradually reducing.
Suppose that the bulls are able to defend the critical support in the $1,700-$1,800 range (in green) and not allow the pair to break below it. In this case, it is expected that the upward trend will continue with the target of $2200 after completing a brief pullback. Conversely, if the price slips below the mentioned support, it gives bears an opportunity to target $1350-1280 (in light blue).
For now, it is better to have patience and see what Ethereum does after hitting this level.

Pagrindiniai palaikymo lygiai: 1800 USD ir 1500 USD
Pagrindiniai pasipriešinimo lygiai: 2000 USD ir 2200 USD
Dienos slenkantys vidurkiai:
MA20: 1753 USD
MA50: 1464 USD
MA100: 1585 USD
MA200: 2253 USD
ETH/BTC diagrama
Ethereum’s super bullish trend against Bitcoin stalled when it hit horizontal resistance at 0.082 BTC (in red). Touching this level in the past has been the starting point for deep corrections. But for now, the pair seems likely to retest the upper resistance until the price aims above the support range at 0.072-0.075 BTC (in yellow). As soon as this support cracks, the trend reversal would be confirmed. In this case, the price can decrease down to 0.065 BTC.
Pagrindiniai palaikymo lygiai: 0.0.75 ir 0.065 BTC
Pagrindiniai pasipriešinimo lygiai: 0.082 ir 0.088 BTC

Grandinės analizė
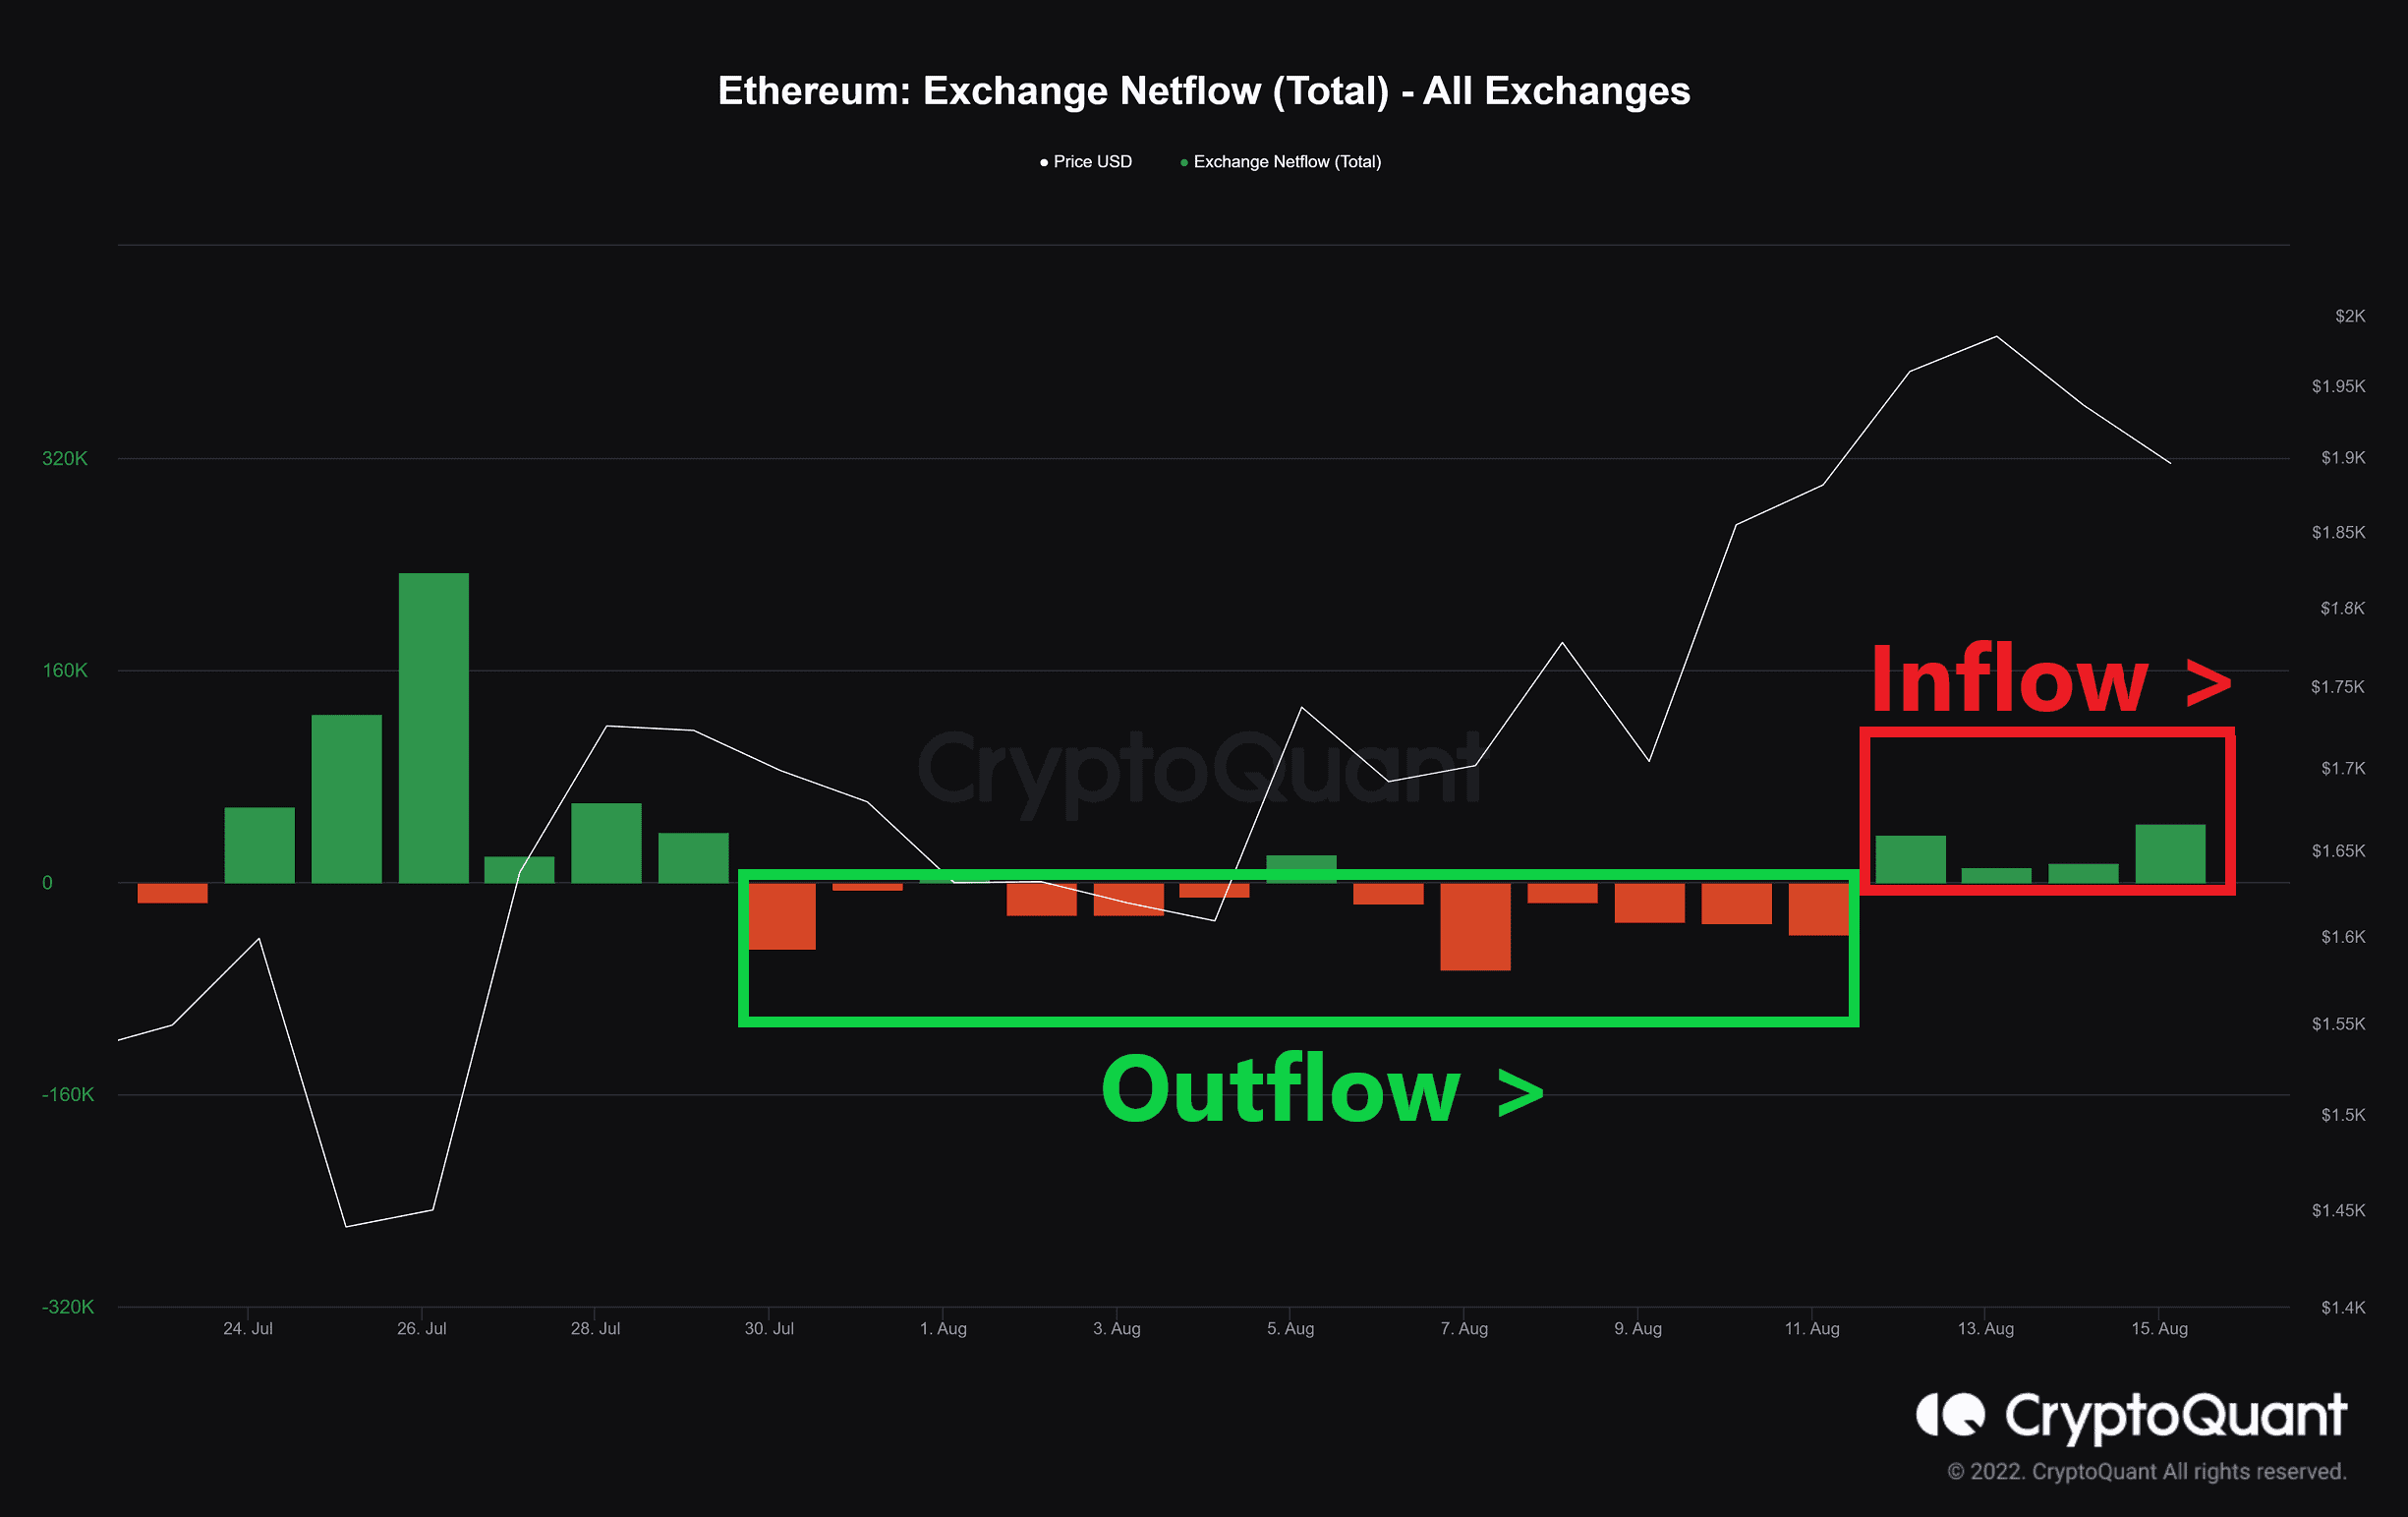
Exchange Netflow
Apibrėžimas: The difference between coins flowing into and out of the exchange. (Inflow – Outflow = Netflow)
A positive value indicates the reserve is increasing.
As shown below, ETH’s upward trend has been accompanied by a decrease in exchange reserve. Red histogram bars indicate that the outflow is greater than the inflow. In the last four days, the histogram bars have turned green. This indicates that investors deposited their coins in exchange for a possible selloff. It is beneficial to know that this inflow is related to the spot market.
„Binance Free“ 100 USD (išskirtinis): Naudokite šią nuorodą užsiregistruoti ir gauti 100 USD nemokamą ir 10% nuolaidą „Binance Futures“ pirmajam mėnesiui (sąlygos).
Specialus „PrimeXBT“ pasiūlymas: Naudokite šią nuorodą užsiregistruoti ir įvesti POTATO50 kodą, kad gautumėte iki 7,000 USD už savo indėlius.
Atsisakymas: „CryptoPotato“ randama informacija, kurią cituoja rašytojai. Tai neatspindi „CryptoPotato“ nuomonės, ar pirkti, parduoti ar laikyti investicijas. Prieš priimant bet kokius investicinius sprendimus, jums patariama atlikti savo tyrimus. Naudokite pateiktą informaciją savo rizika. Norėdami gauti daugiau informacijos, žr.
Kriptovaliutų diagramos pateikė „TradingView“.
Source: https://cryptopotato.com/eth-rejected-from-2k-heres-the-critical-support-to-hold-ethereum-price-analysis/