While the long-term Grandinės jungtis (LINK) price direction is bullish, the direction of the short-term trend could be determined by whether LINK breaks out or gets rejected from the $6.96 area.
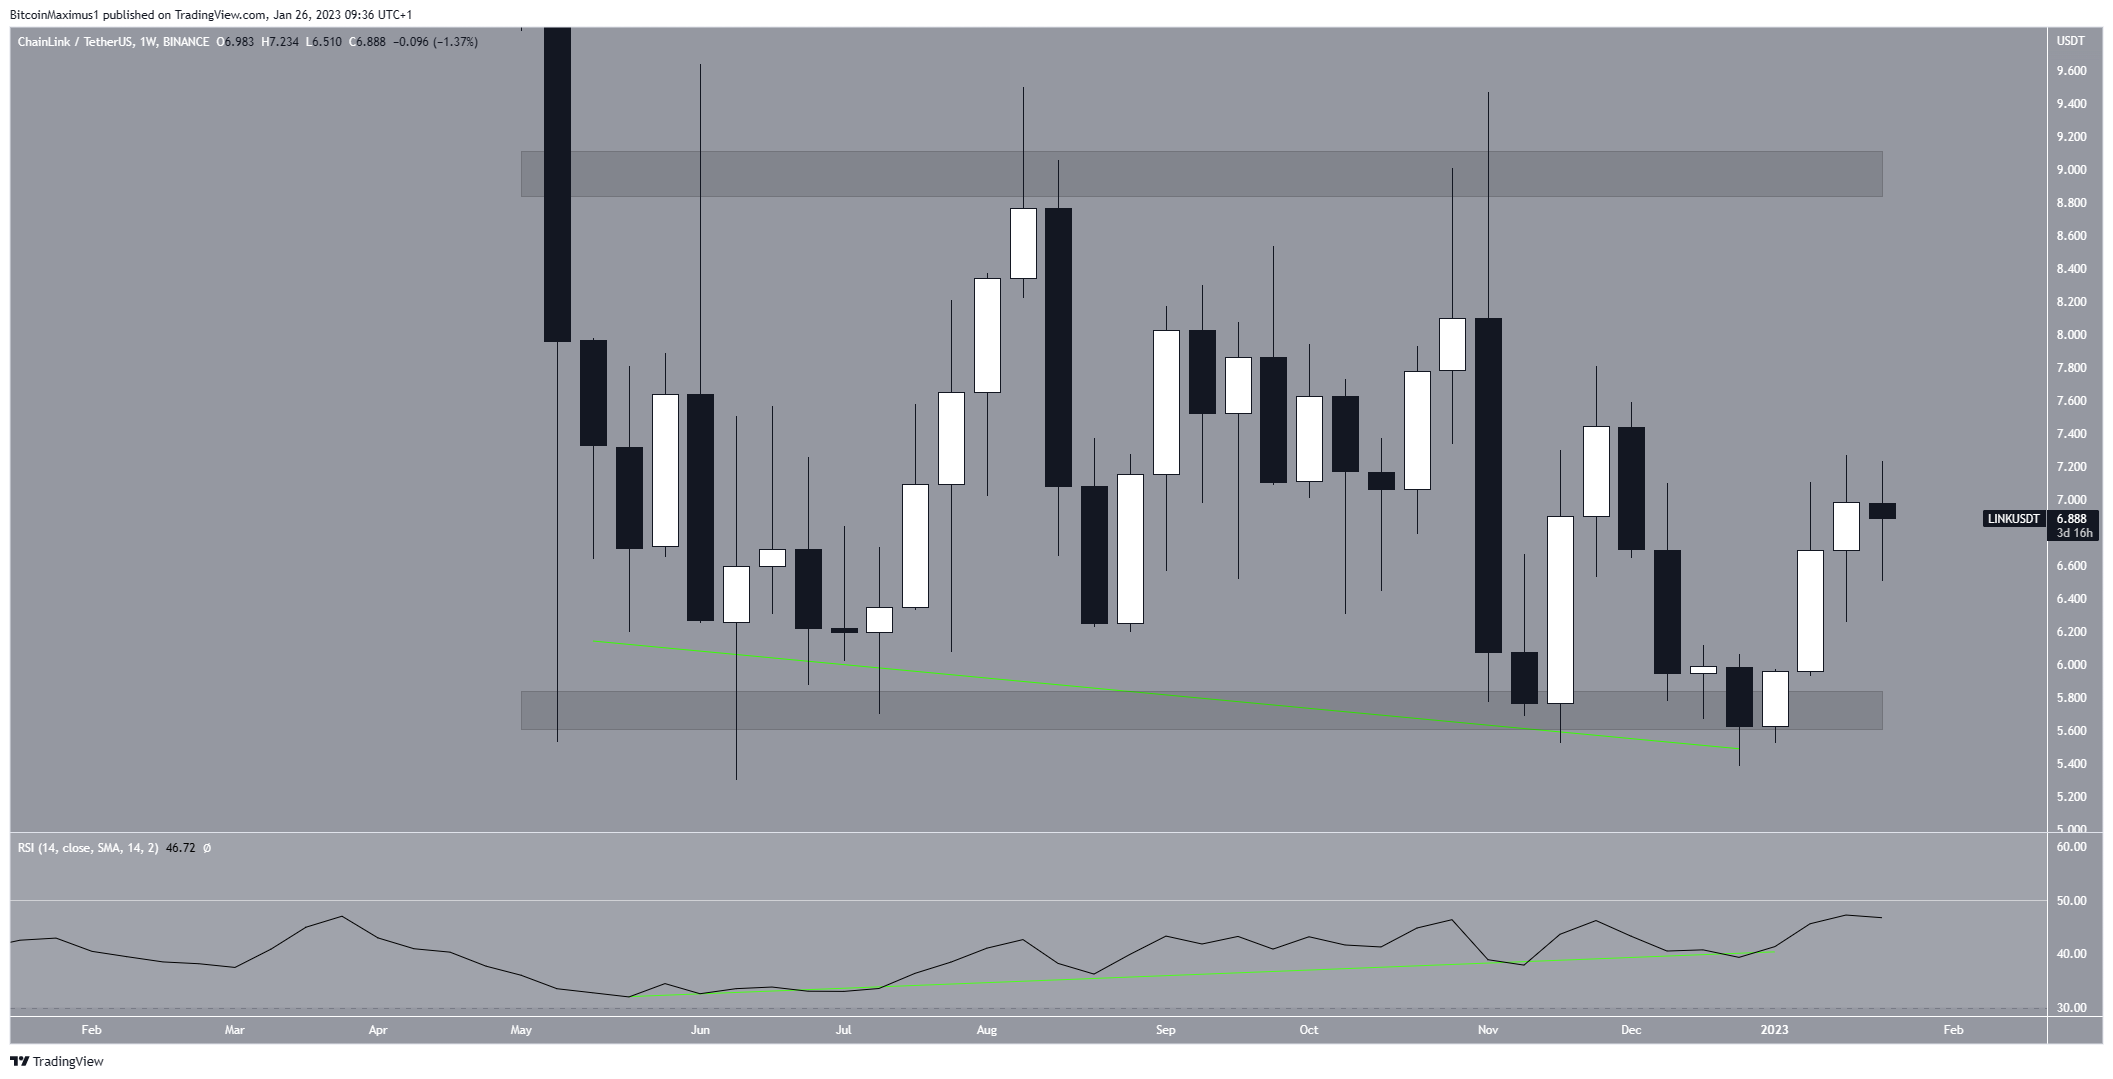
Since May 2022, the Chainlink kaina has traded above the $5.75 horizontal support area. While it reached a minimum price of $5.30, the LINK price managed to hold on above the $5.75 support area in the weekly time frame.
During this entire period, the weekly RSI generated bullish divergence (green line). Divergence in such a high time frame is rare and often precedes significant bullish trend reversals.
If the upward movement continues, the next resistance area would be at $9. The price has not reached a close above this level since May 2022. If it does, the rate of increase could accelerate further toward the next resistance at $18.

On the other hand, a weekly close below $5.75 would mean that the trend is still bearish. In that case, the LINK price could fall toward $4.
Due to the bullish divergence, a breakout is more likely.
Chainlink Price Prediction for Feb: Eventual Breakout Likely
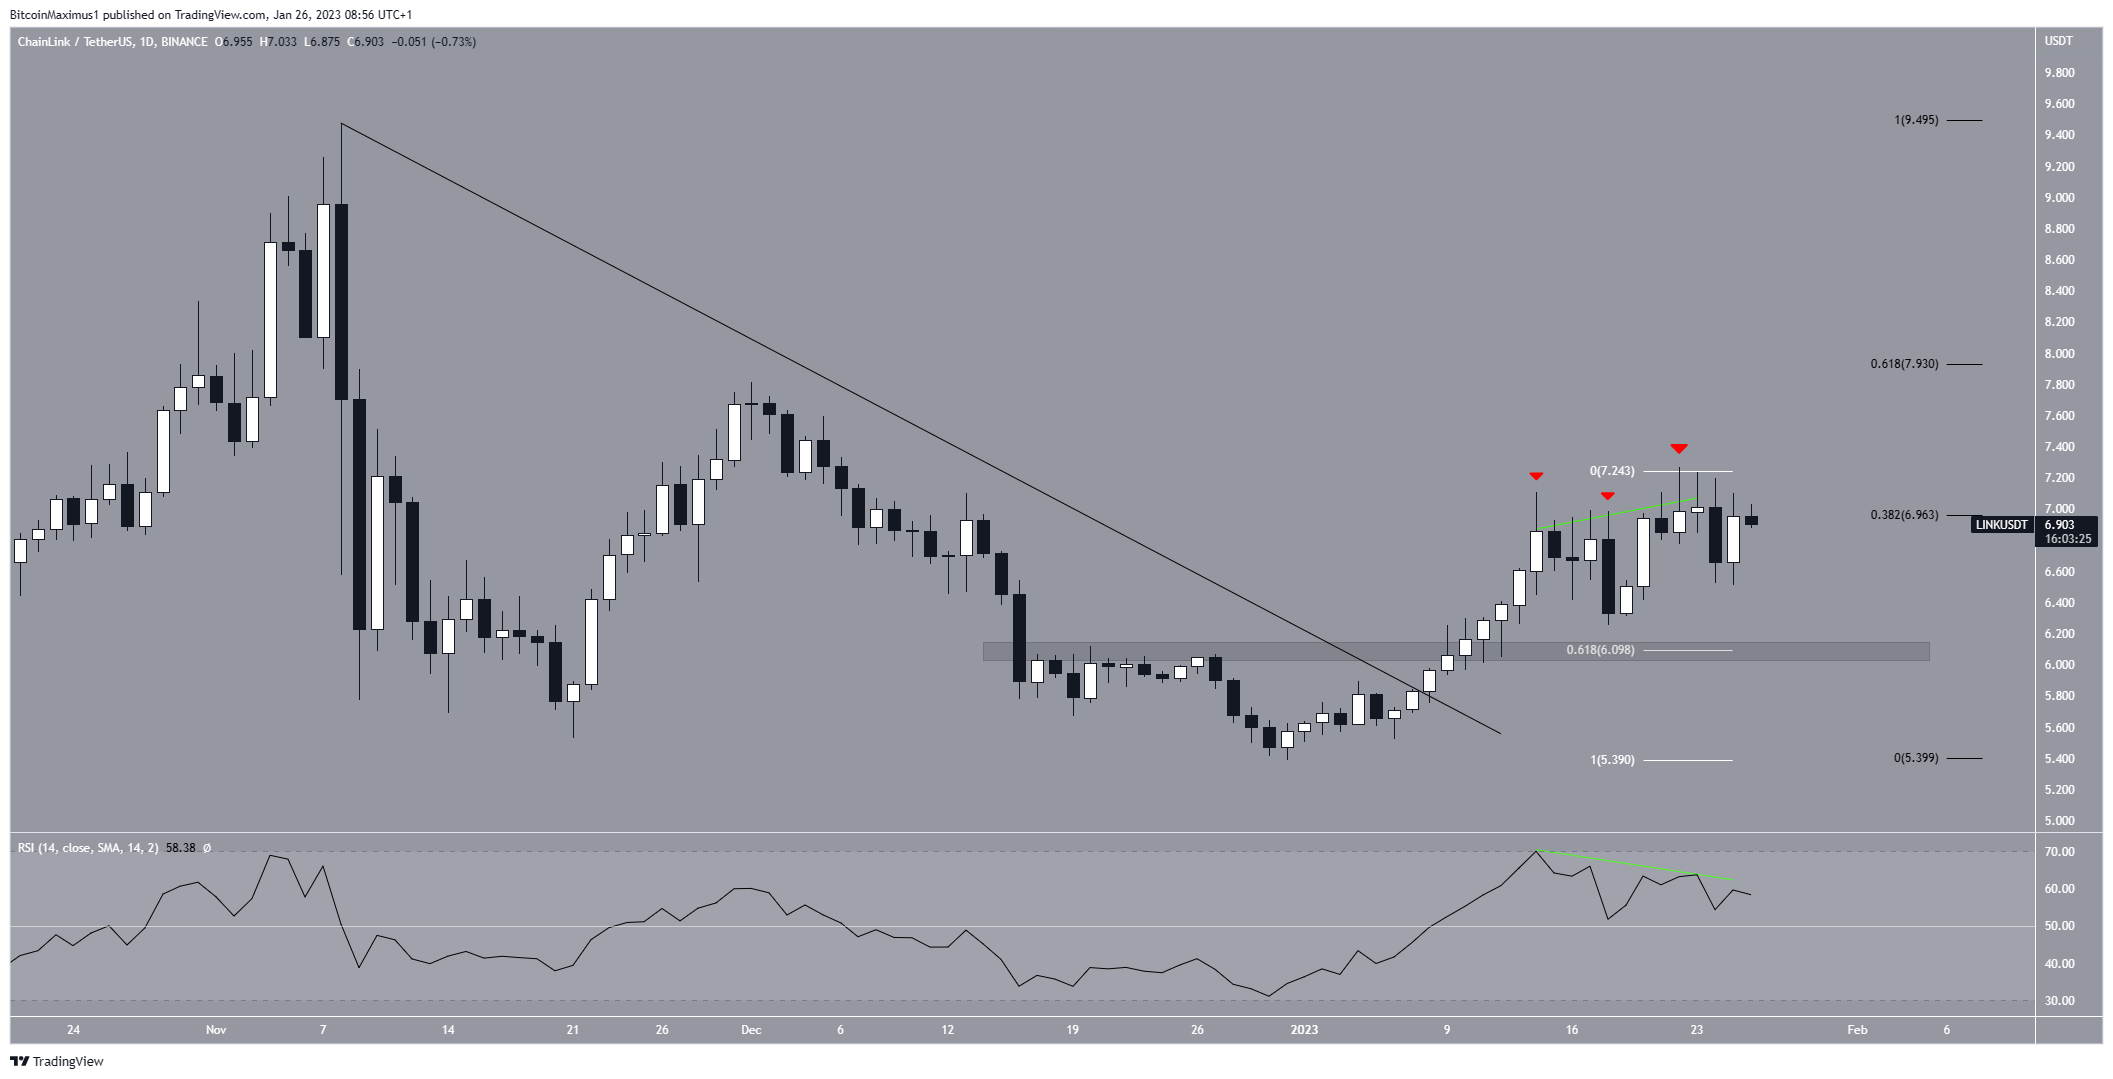
The technical analysis from the daily time frame shows that the Chainlink price broke out from a descending resistance line on Jan. 8, initiating the current increase.
Currently, the LINK token is attempting to break out from the 0.382 Fib retracement resistance level at $6.96. So far, it has made three unsuccessful attempts at doing so (red icons), which have been combined with bearish divergence on the RSI (green line).
If a breakout occurs, it will bode well for the future price, likely leading to an increase toward the 0.618 Fib retracement resistance level at $7.93. Conversely, a rejection could lead to a fall toward the closest support area at an average price of $6.10. The 0.618 Fib retracement support level and a horizontal support area create the support area.
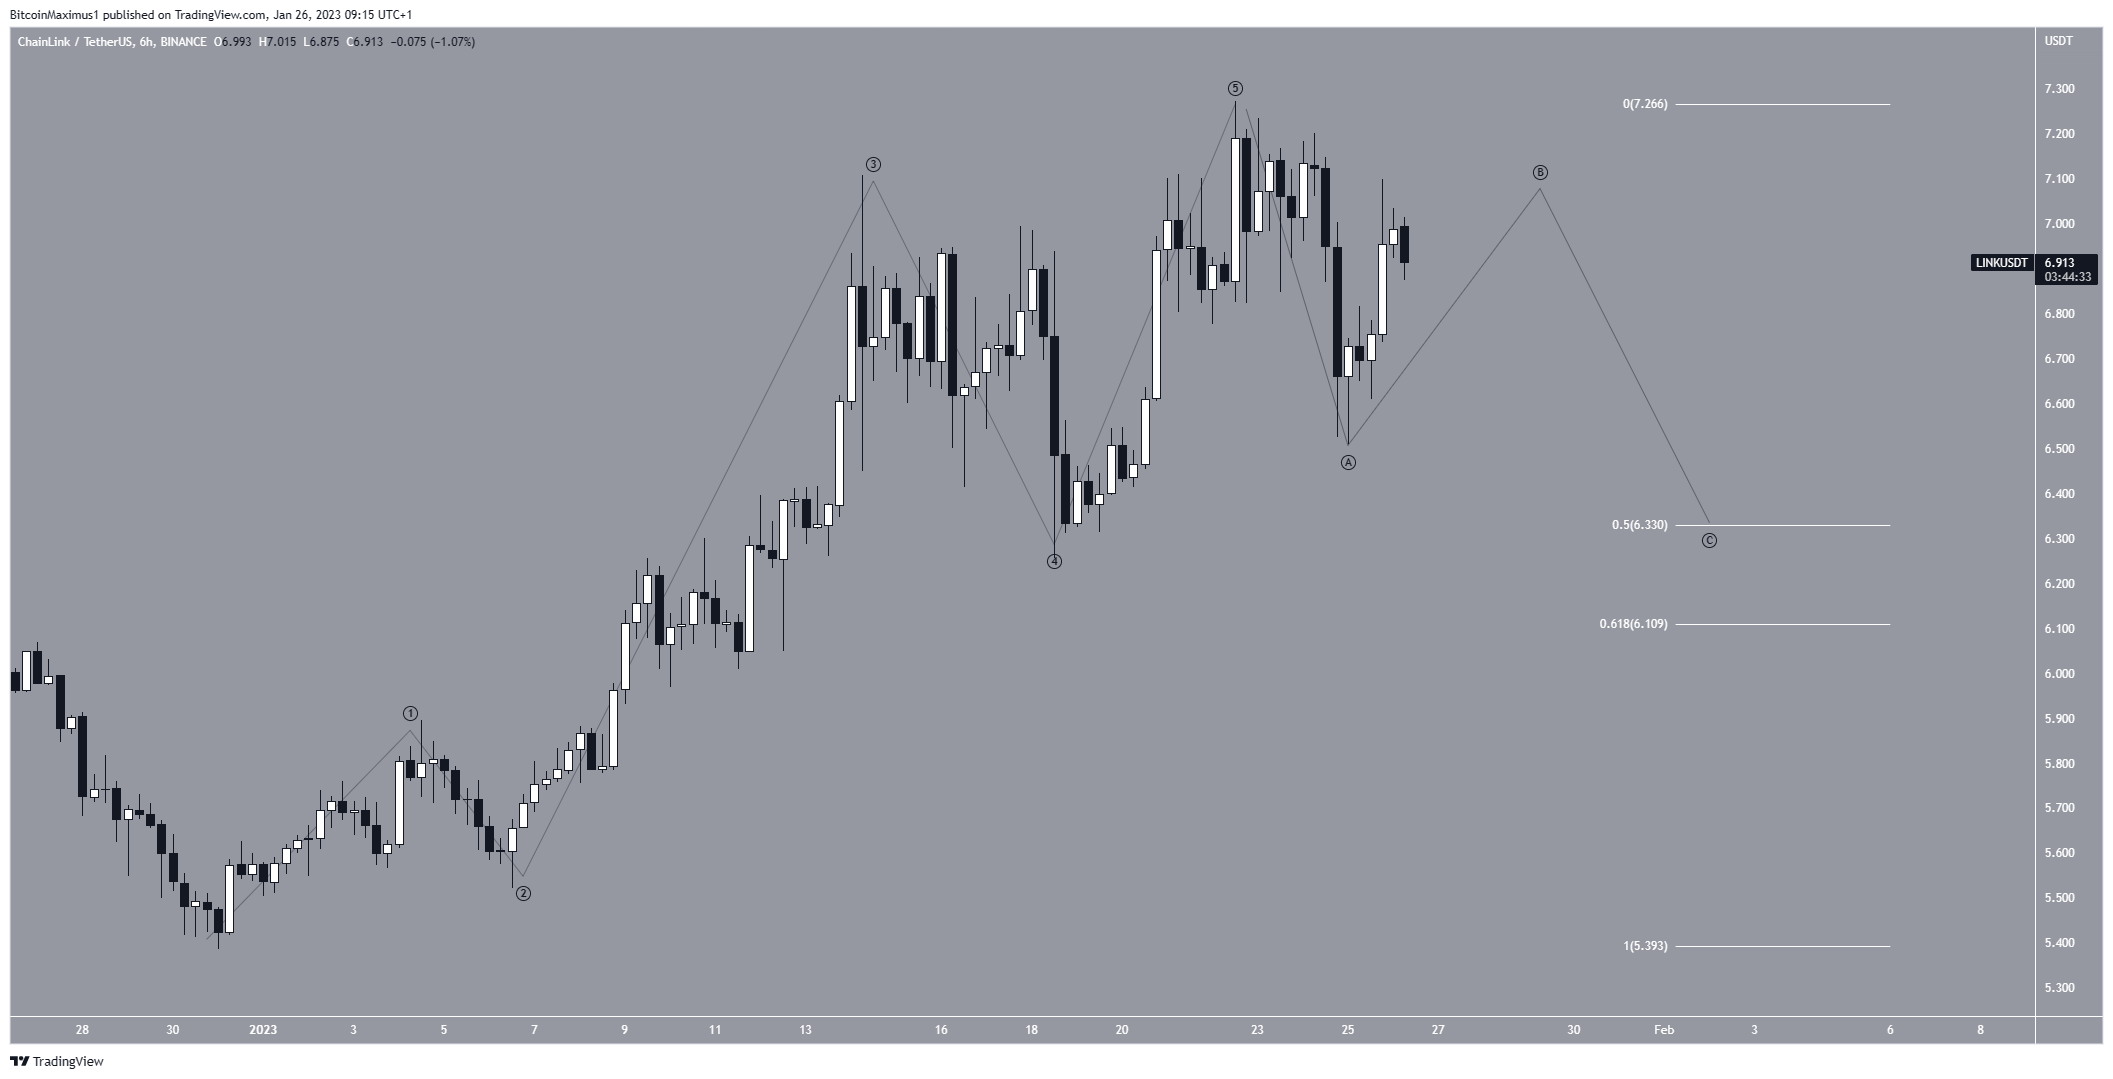
The short-term six-hour time frame shows that the Chainlink price completed a five-wave upward movement and is now correcting inside an A-B-C corrective structure (black). As a result, it supports the possibility that the LINK price will continue to decrease in the next 24 hours, reaching a bottom at the 0.5-0.618 Fib retracement support levels at $6.11-$6.33.
Afterward, the upward movement will continue, providing a bullish Chainlink price prediction for Feb.
An increase above the current highest price of $7.27 would mean that the retracement is complete, likely leading to highs near the 0.618 Fib retracement resistance level at $7.93.
To conclude, the most likely Chainlink price forecast is a drop toward the $6.10-$6.33 area followed by a massive upward movement. A short-term increase above $7.27 would indicate that the drop will not occur, rather that the LINK price will immediately increase.
Dėl naujausios BeInCrypto kriptovaliutų rinkos analizės, spauskite čia.
Atsakomybės neigimas
BeInCrypto stengiasi pateikti tikslią ir naujausią informaciją, tačiau ji nebus atsakinga už trūkstamus faktus ar netikslią informaciją. Jūs laikotės ir suprantate, kad bet kokią šią informaciją turėtumėte naudoti savo rizika. Kriptovaliutos yra labai nepastovus finansinis turtas, todėl tyrinėkite ir priimkite savo finansinius sprendimus.
Source: https://beincrypto.com/chainlink-link-price-prediction-feb-9-expected/