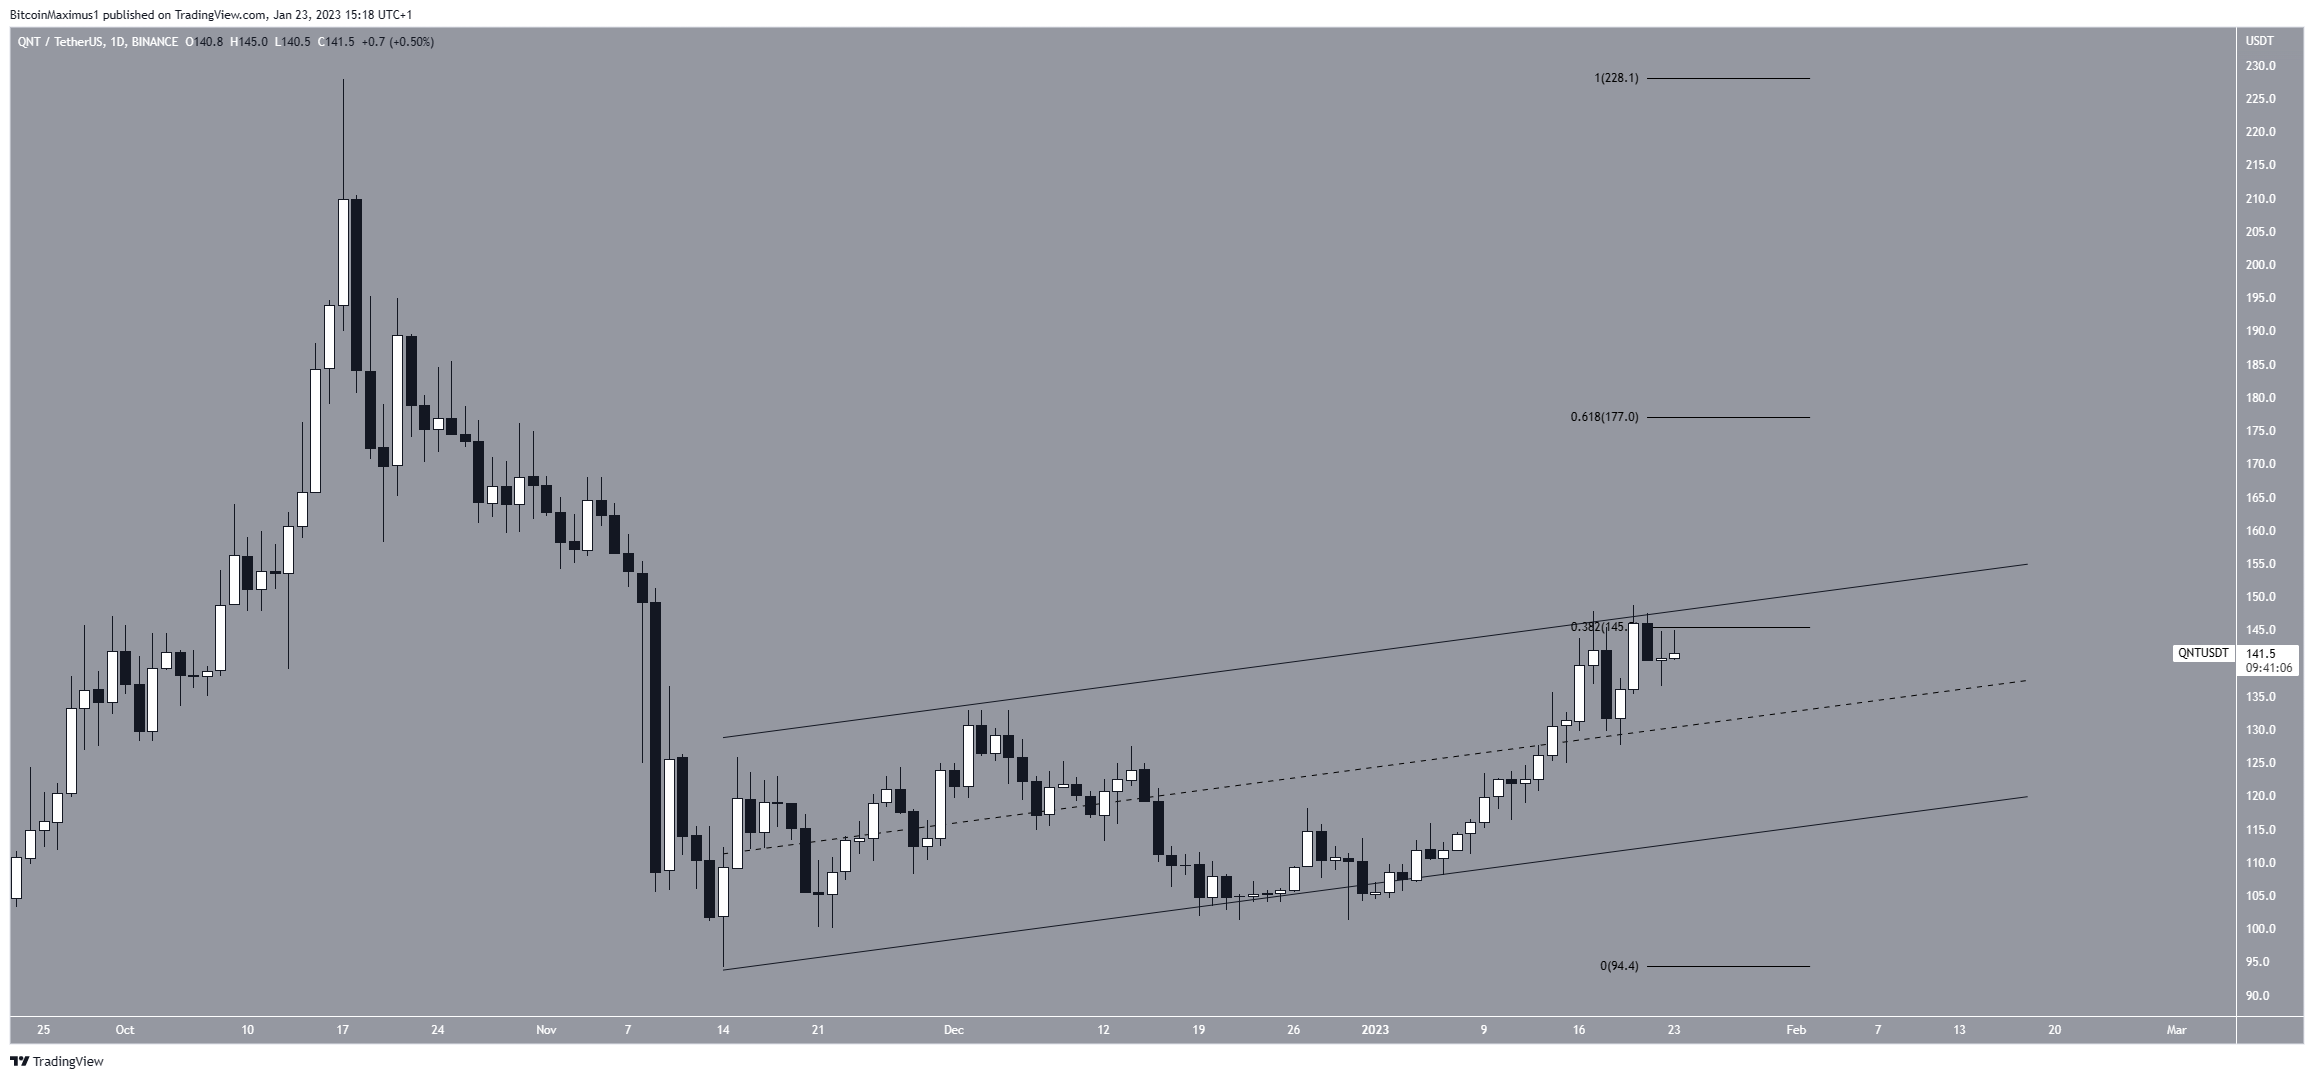
The Quant (QNT) price has created a bearish pattern inside a confluence of resistance levels near an average price of $145.50. A rejection from the area is the most likely Quant price forecast.
The Quant kaina has increased inside a long-term ascending parallel channel since Nov. 14, 2022. Such channels usually contain corrective movements, meaning that an eventual breakdown from it would be expected. While trading in the channel, QNT reached a maximum price of $148.70.
Currently, the price is facing resistance from both the channel’s resistance line and the 0.382 Fib retracement resistance level at $145.50. Therefore, whether it breaks out or gets rejected from this area could determine the future trend’s direction.
If a breakout transpires, the next resistance would be at $177, created by the 0.618 Fib retracement resistance level. On the other hand, a rejection could lead to a downward movement toward the channel’s support line at $120.

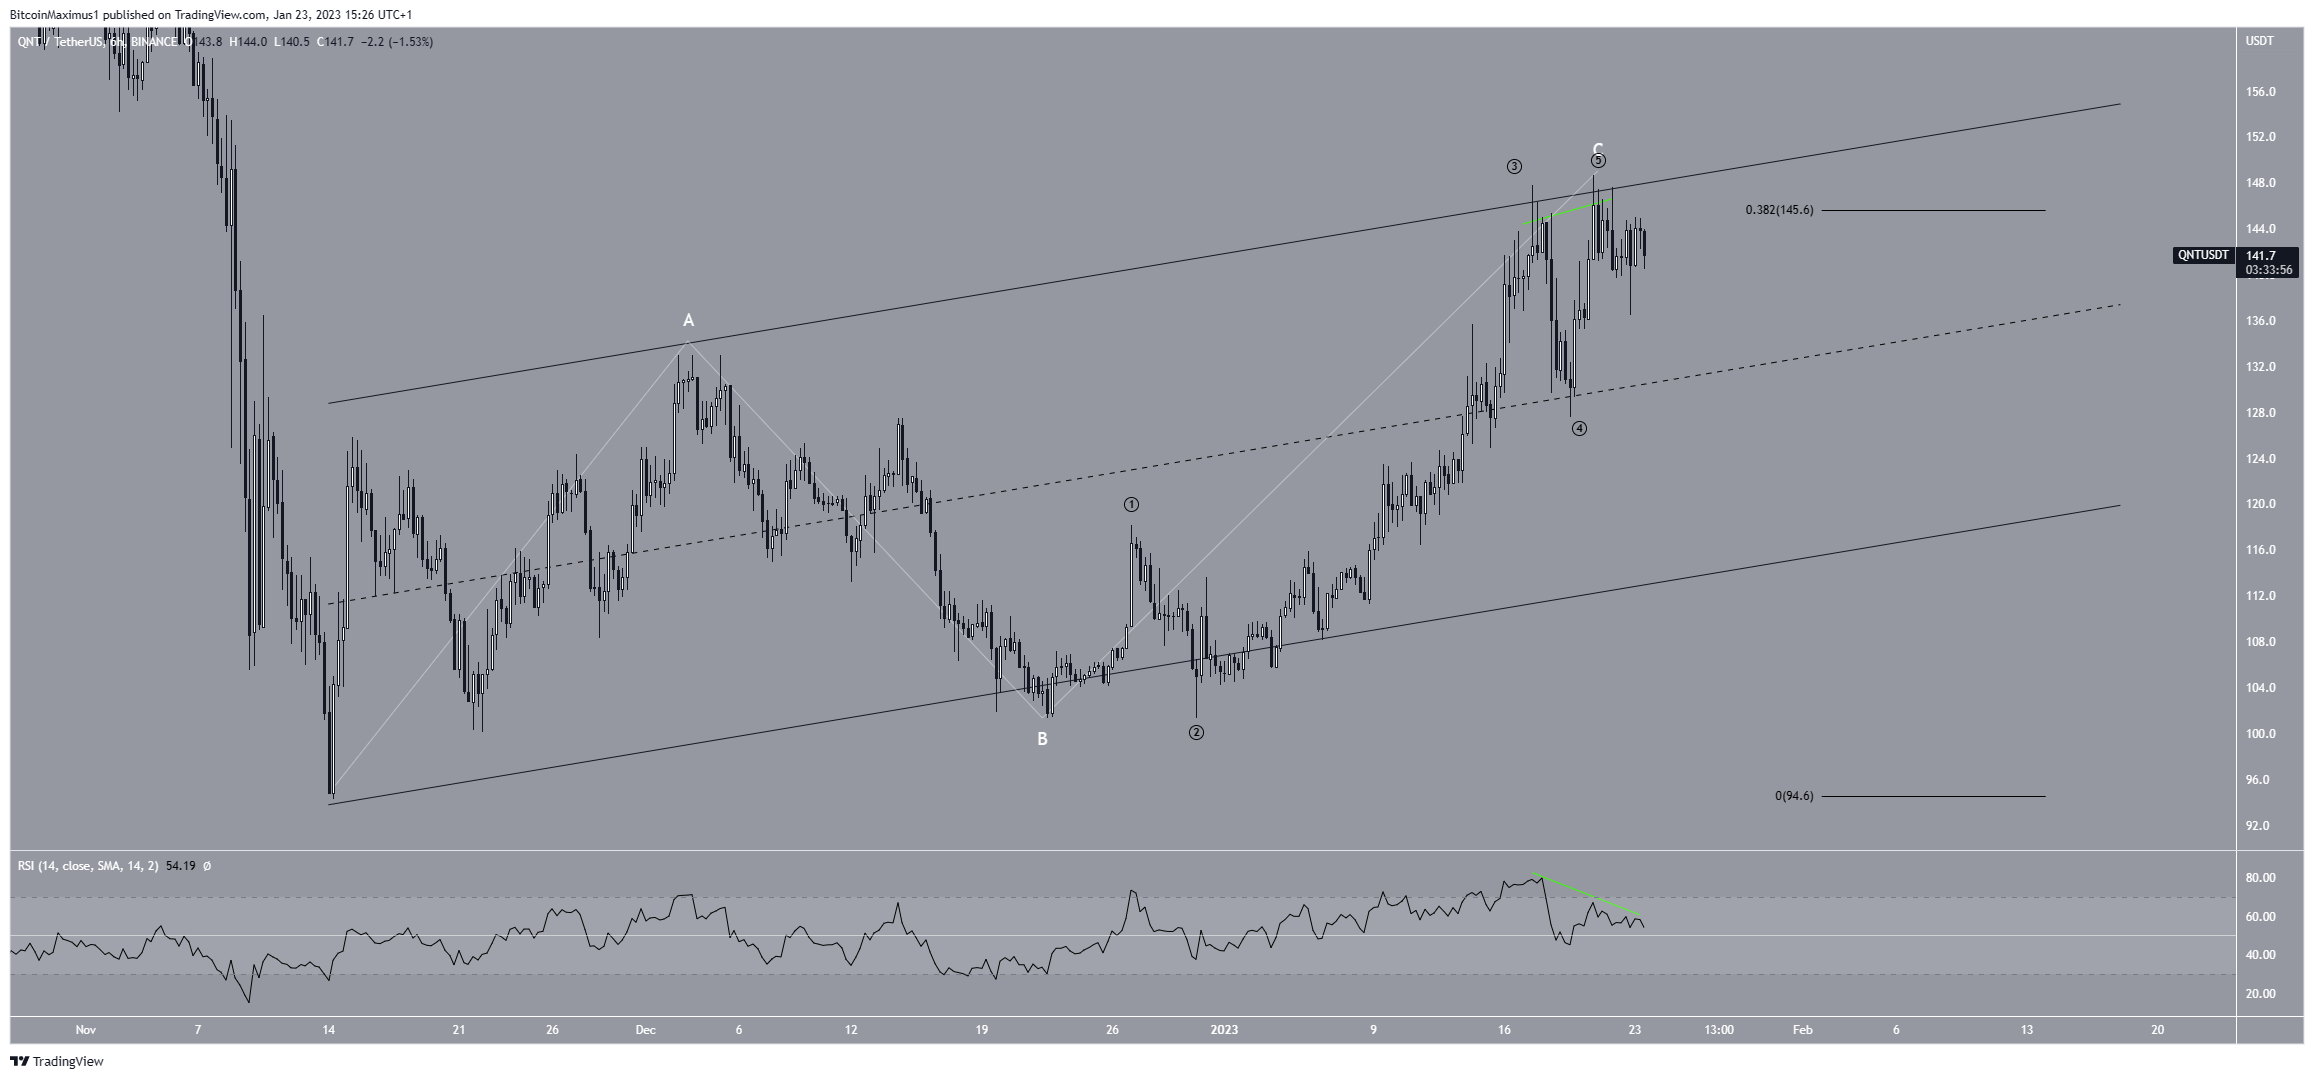
A look at a lower time frame is required in order to determine which will occur.
Quant Price Prediction for Feb: Is the Bulls’ Party Over?
The technical analysis from the short-term six-hour chart provides a more bearish outlook. There are several reasons for this.
First, the QNT price has created a double top pattern. This is considered a bearish pattern that often leads to bearish trend reversals. To add to the negative outlook, the pattern was combined with bearish divergence in the RSI.
Second, the movement inside the channel looks like a completed A-B-C corrective structure (white). Since the channel is considered a corrective pattern, this fits perfectly with the bearish reading.
Finally, the confluence of resistance levels increases the possibility that the QNT price will get rejected.
In turn, this provides a bearish Quant price prediction for Feb., indicating that the Quant price will eventually break down from the channel.
To conclude, the most likely Quant price prediction for Feb. is a gradual decrease and eventual breakdown from the channel. If this occurs, it could take the QNT price to the Nov. lows at $92.
On the other hand, breaking out from the channel would invalidate this bearish outlook and suggest that the QNT price will increase toward $177.
Dėl naujausios BeInCrypto kriptovaliutų rinkos analizės, spauskite čia.
Atsakomybės neigimas
BeInCrypto stengiasi pateikti tikslią ir naujausią informaciją, tačiau ji nebus atsakinga už trūkstamus faktus ar netikslią informaciją. Jūs laikotės ir suprantate, kad bet kokią šią informaciją turėtumėte naudoti savo rizika. Kriptovaliutos yra labai nepastovus finansinis turtas, todėl tyrinėkite ir priimkite savo finansinius sprendimus.
Source: https://beincrypto.com/quant-qnt-price-slides-despite-bullish-crypto-market-what-you-should-know/