Makrokomandų apžvalga
Recap of critical events, week commencing Oct. 10
As CryptSslate attended Bitcoin Amsterdam, there was no weekly MacroSlate report for the week commencing Oct. 10. Key macro topics that occurred were;
On Oct. 13, the U.S. CPI inflation report showed a worrying jump in prices excluding food and energy for September, pushing the ten-year treasury to a high of 4.08%.
While Oct. 14 saw the U.K experience U-turn after U-turn on fiscal policy. BOE jumbo-sized gilt purchases were finalized, which stabilized yields. This leaves Japan as the only G7 central bank still supporting its government debt, while the ten-year treasury was above 25 bps and the yen against the dollar kept making fresh highs.
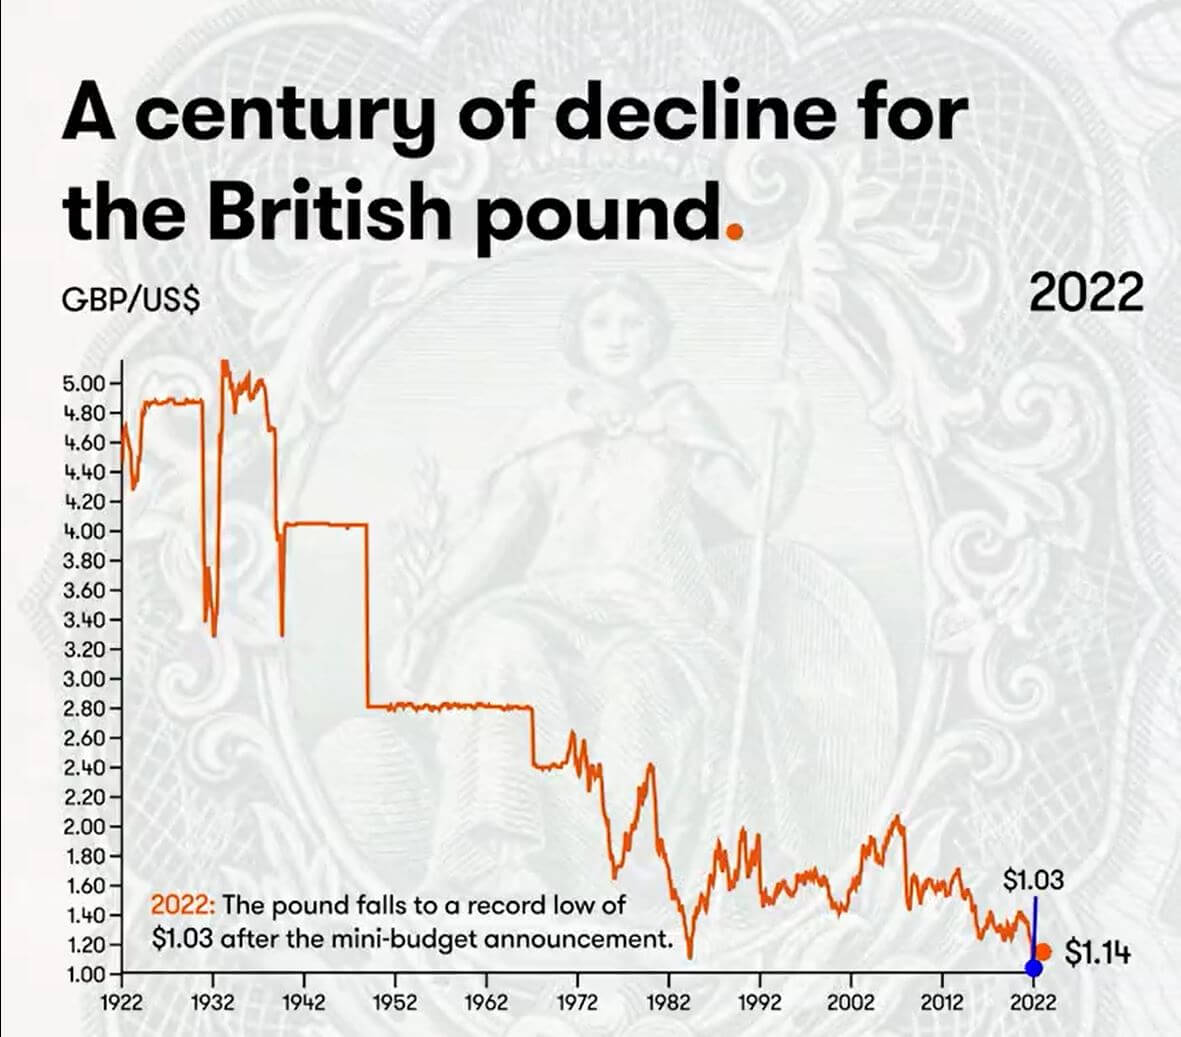
A century of decline for the British pound
The year 2022 has seen new lows for the British pound, with a government in disarray, the gilt market unstable, and the BOE acting as a backstop. The impact of poor monetary and fiscal policy decisions as its long-term bond yields convulsed and threatened the solvency of over-leveraged pension funds.
However, many investors believe this is a cycle, and the pound will return. If it’s cheap to buy, investors will buy it. However, this may not be the case; the U.K. is facing acute energy shortages and minimal fx reserves to defend the currency.
The last century has seen a massive decline in the British pound, and it doesn’t look like it will get better soon.
Since the U.S dollar came into existence in 1791, the free market rate was $4.55 to £1. Fast forward to 1925, and the pound has been sliding down against the dollar.
- 1925 – Winston Churchill returns sterling to the gold standard at the pre-war rate of $4.86.
- 1931 – The sterling comes off the gold standard, and the pound drops considerably. £1 is equivalent to $3.28.
- 1940 – Sterling drops with the outbreak of WWII. The British government pegs the value at £1 to $4.03.
- 1949 – The British government devalues the pound to $2.80 to support exports and rebalance the economy.
- 1967 – An economic crisis strikes. The British government devalues the pound to $2.40
- 1976 – High unemployment and inflation forced Britain to request an IMF loan. Sterling is allowed to float.
- 1985 – Ronald Regan’s tax cuts boosted the U.S economy and led to immense dollar strength.
- 1992 – the U.K exits the Exchange Rate Mechanism, and the pound drops to $1.48.
- 2001 – The pound falls to $1.40 after the dot-com bubble.
- 2008 – Global financial crash sees the dollar act as a haven currency.
- 2016 – Brexit referendum sees the pound fall to $1.23.
- 2022 – The pound falls to a record low of $1.03 after the mini-budget announcement.
(If you are curious, from 1861 – 1864, the £ surge to $~9 was US money fleeing the Civil War.)
Koreliacijos
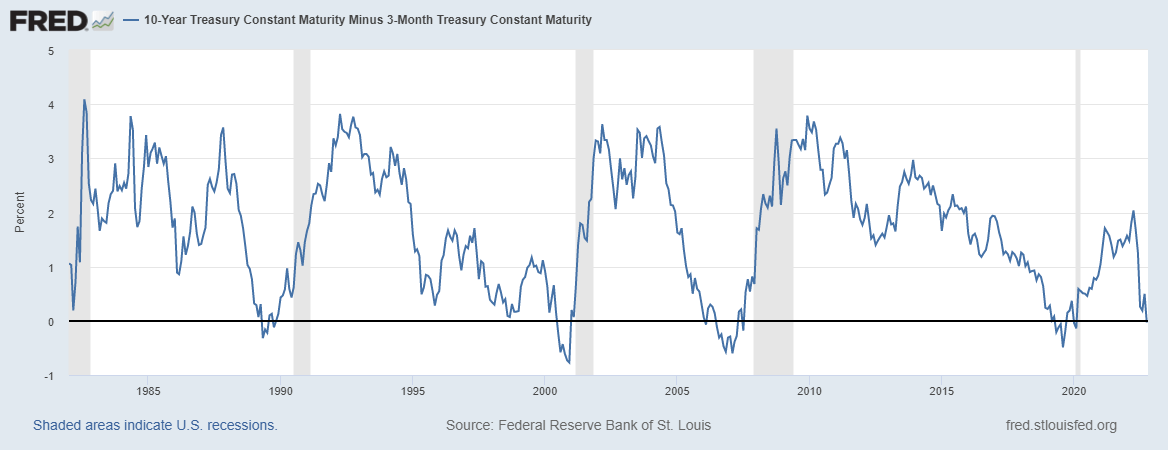
10 Year minus three-month treasury inverts has preceded every recession since WWII
When the 10-year and 2-year treasury note spread inverts, it is generally considered a warning of severe economic weakness; In contrast, when the credit spreads widen during times of financial stress, the flight to safe-haven assets such as the DXY, or the immediate need for dollar redemptions to meet payments.
The 10- year-three month spread inverted on Oct. 18, currently at -0.03bps, as many economists believe this is the accurate recession signal. The inversion of each yield curve has presaged every recession going back more than 40 years, and a recession usually occurs within the next six-twelve months.
Akcijos ir nepastovumo matuoklis
„Standard and Poor's 500“ arba tiesiog „S&P 500“ yra akcijų rinkos indeksas, stebintis 500 didelių JAV biržose listinguojamų įmonių akcijų rezultatus. „S&P 500“ 3,753 2.14% (5D)
Nasdaq vertybinių popierių rinka yra Amerikos vertybinių popierių birža, įsikūrusi Niujorke. Ji užima antrąją vietą biržų sąraše pagal prekiaujamų akcijų kapitalizaciją, po Niujorko vertybinių popierių biržos. NASDAQ 11,310 2.48% (5D)
Cboe nepastovumo indeksas arba VIX yra realaus laiko rinkos indeksas, atspindintis rinkos lūkesčius dėl nepastovumo per ateinančias 30 dienų. Investuotojai, priimdami investicinius sprendimus, naudoja VIX, norėdami išmatuoti rizikos, baimės ar streso lygį rinkoje. VIX 30 -8.33% (5D)
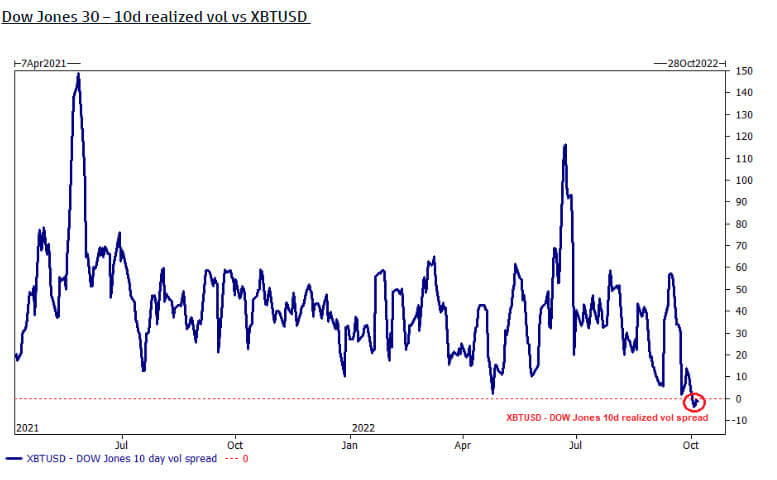
Bitcoin is less volatile than the Dow Jones
The Dow Jones (30 largest industrial stocks) is officially more volatile than Bitcoin, according to the ten-day realized vol spread. However, this is because Bitcoin over Q3 has stayed relatively flat in terms of USD price.
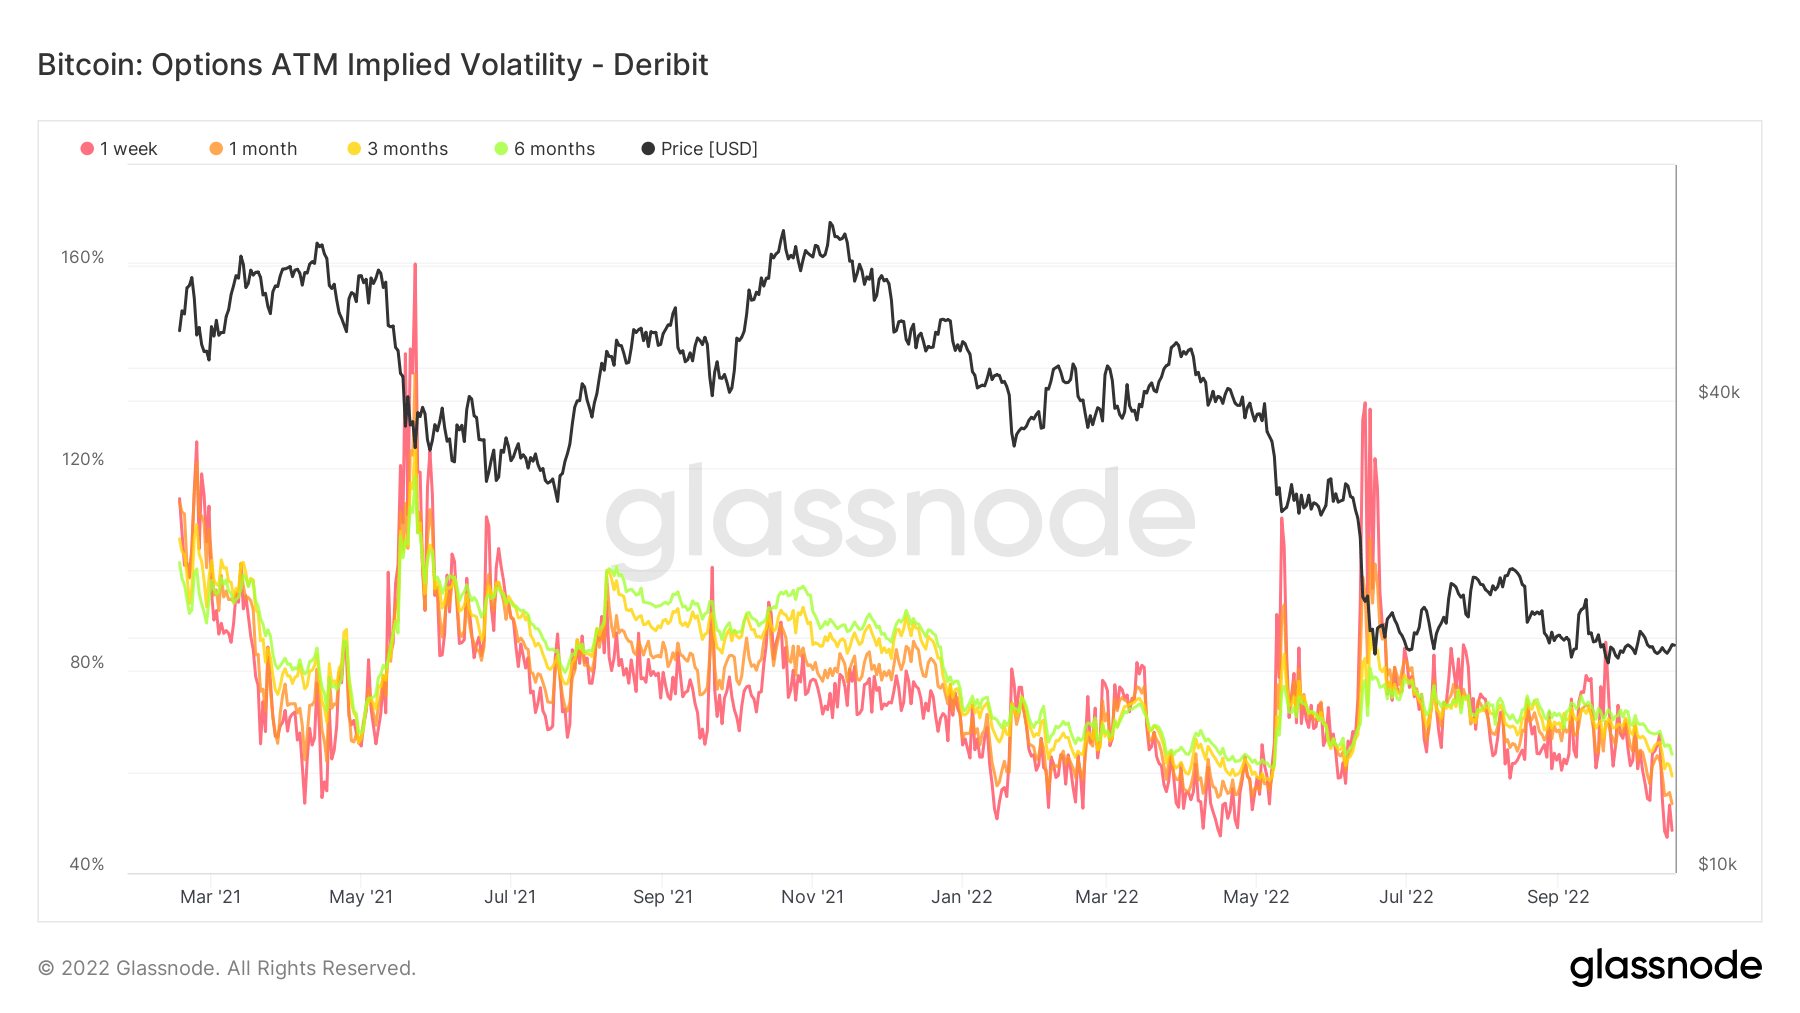
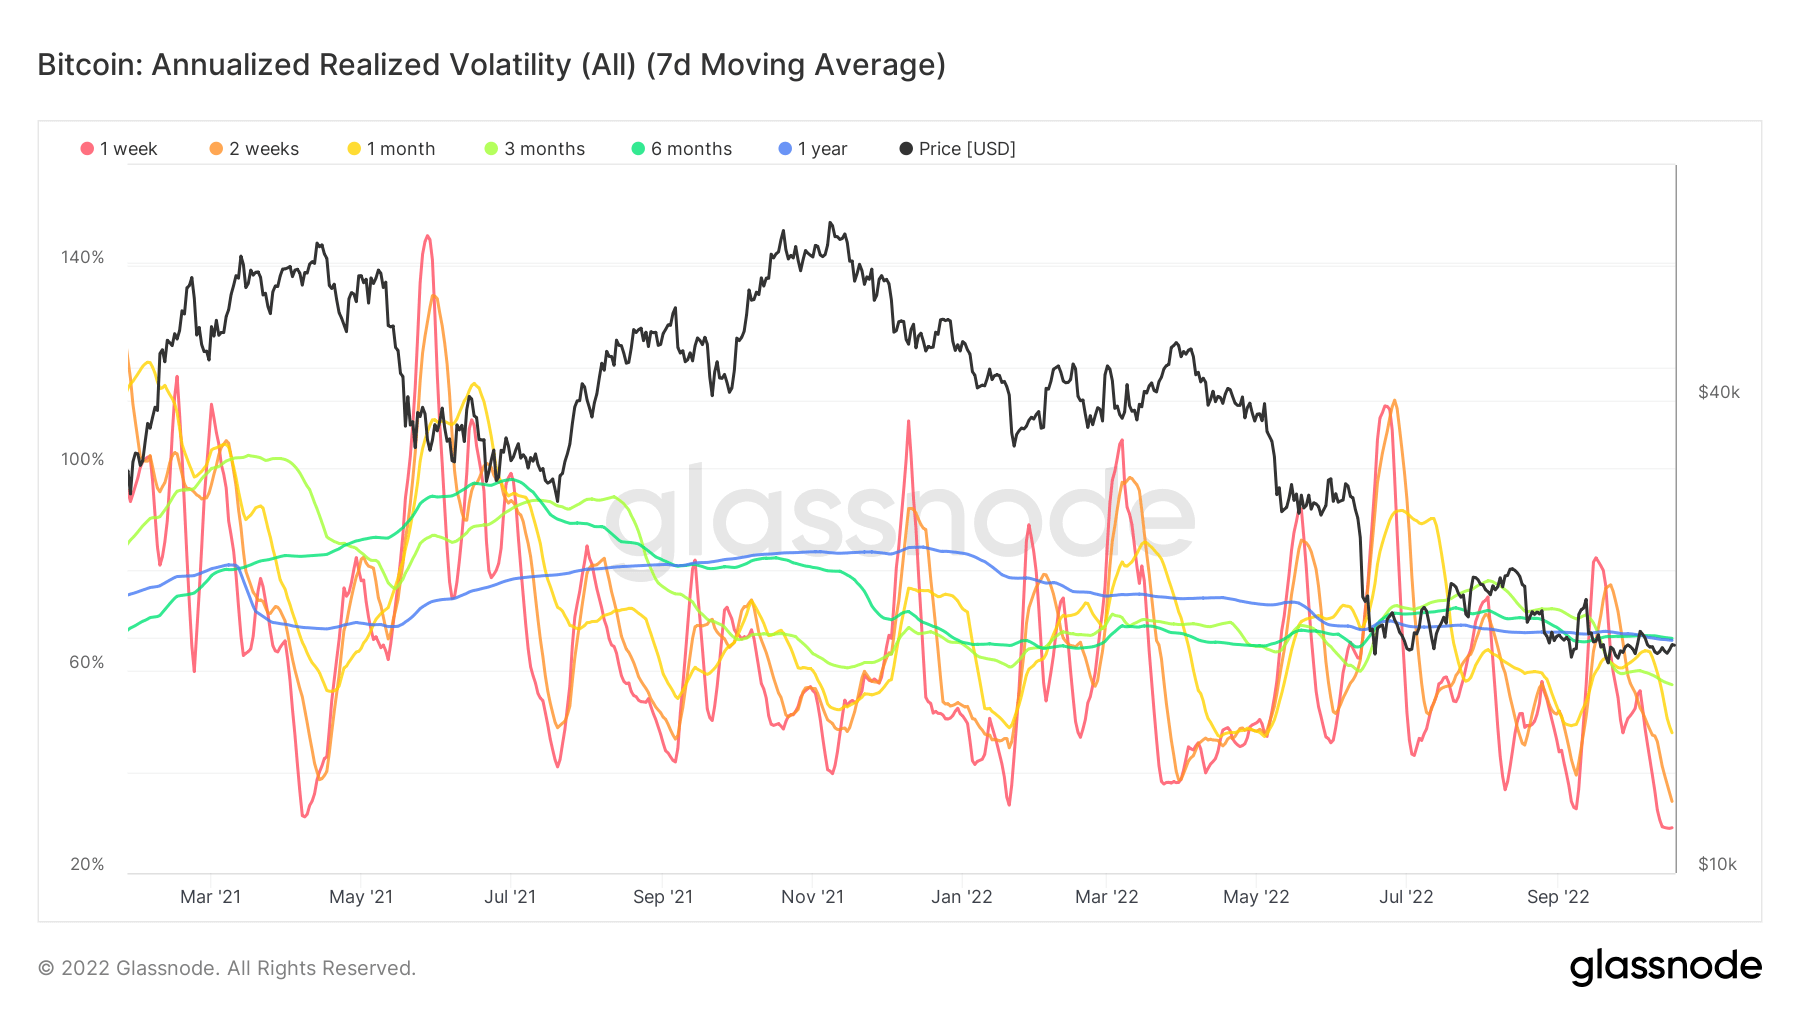
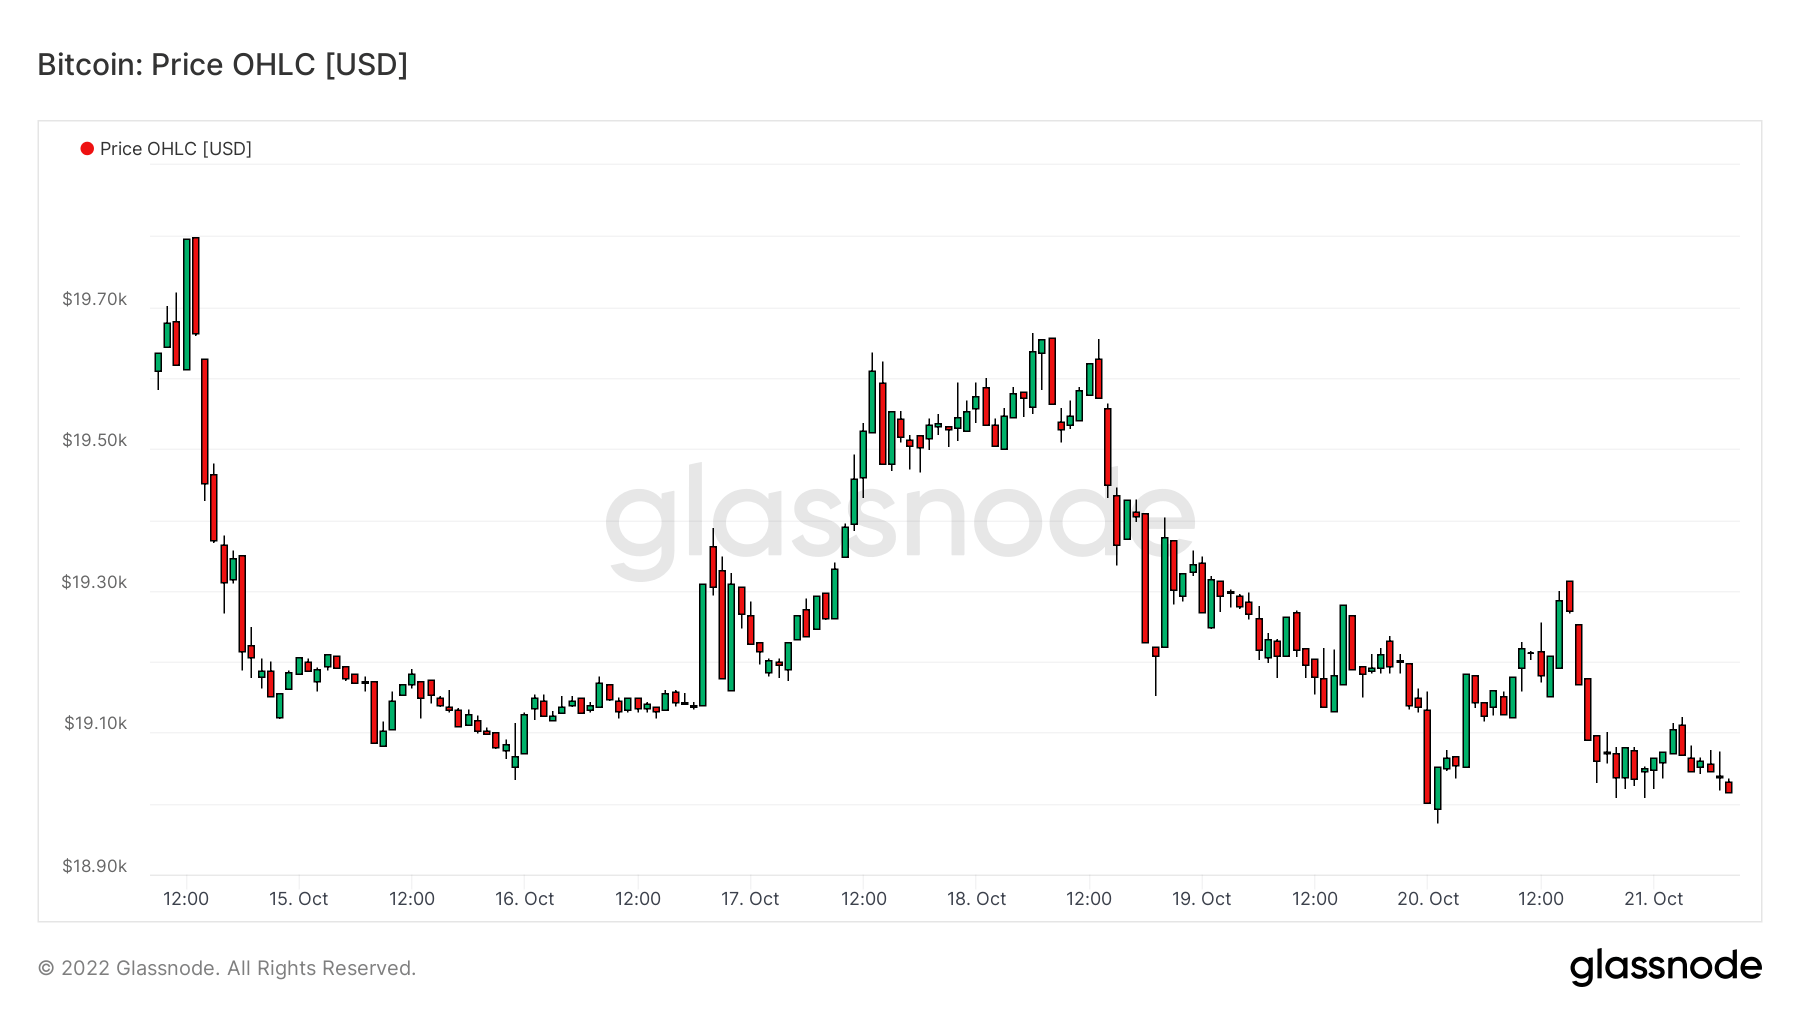
Bitcoin volatility at year-to-date lows
On-chain analytics shows the annualized realized volatility at an all-time low, just under 50% this week. Since March 2021, options implied volatility has been under 50% four times and has seen violent swings in price shortly after.
O numanomas nepastovumas refers to the market’s assessment of future volatility, realized volatility measures what happened in the past. Insinuating that volatility has been at extremely low levels is encouraging, while traditional financial assets and currencies are as volatile as they come.

Commodities
Aukso paklausą lemia aukso kiekis centrinio banko atsargose, JAV dolerio vertė ir noras laikyti auksą kaip apsidraudimą nuo infliacijos ir valiutos devalvacijos – visa tai padeda didinti tauriojo metalo kainą. Aukso kaina $1,658 0.61% (5D)
Panašiai kaip ir daugumos prekių, sidabro kainą lemia spekuliacijos ir pasiūla bei paklausa. Taip pat įtakos turi rinkos sąlygos (stambūs prekybininkai ar investuotojai ir skolintų vertybinių popierių pardavimas), pramonės, komercijos ir vartotojų paklausa, apsidraudimas nuo finansinio streso ir aukso kainos. Sidabro kaina $19 5.52% (5D)
U.S. homebuilders’ sentiment hits a new low
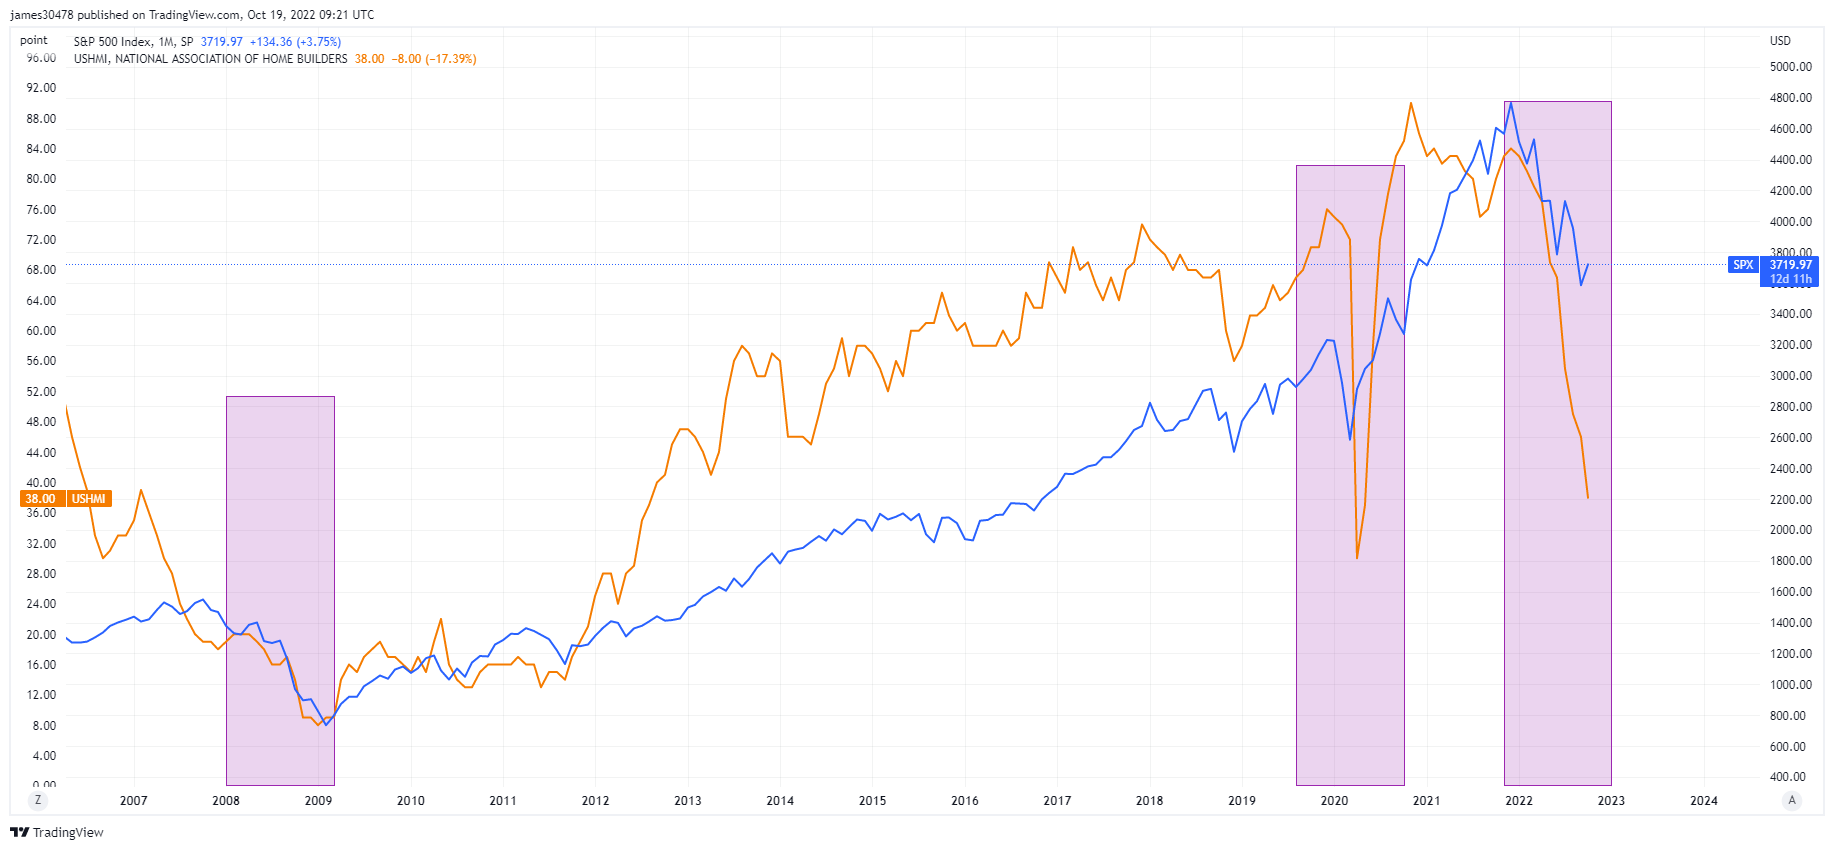
The National Association of House Builders, housing market index sank another 8 points to 38 in October, going back to lows last seen in 2012, just after the GFC recovery. Mortgage rates approaching 7% have significantly weakened demand.
Overlaying the NAHB and S&P 500, with the past two recessions in 2008 and 2020, doesn’t bode well for what’s coming at the end of this year and into 2023; equities could continue to plunge further to the downside if the trend continues to be your friend.
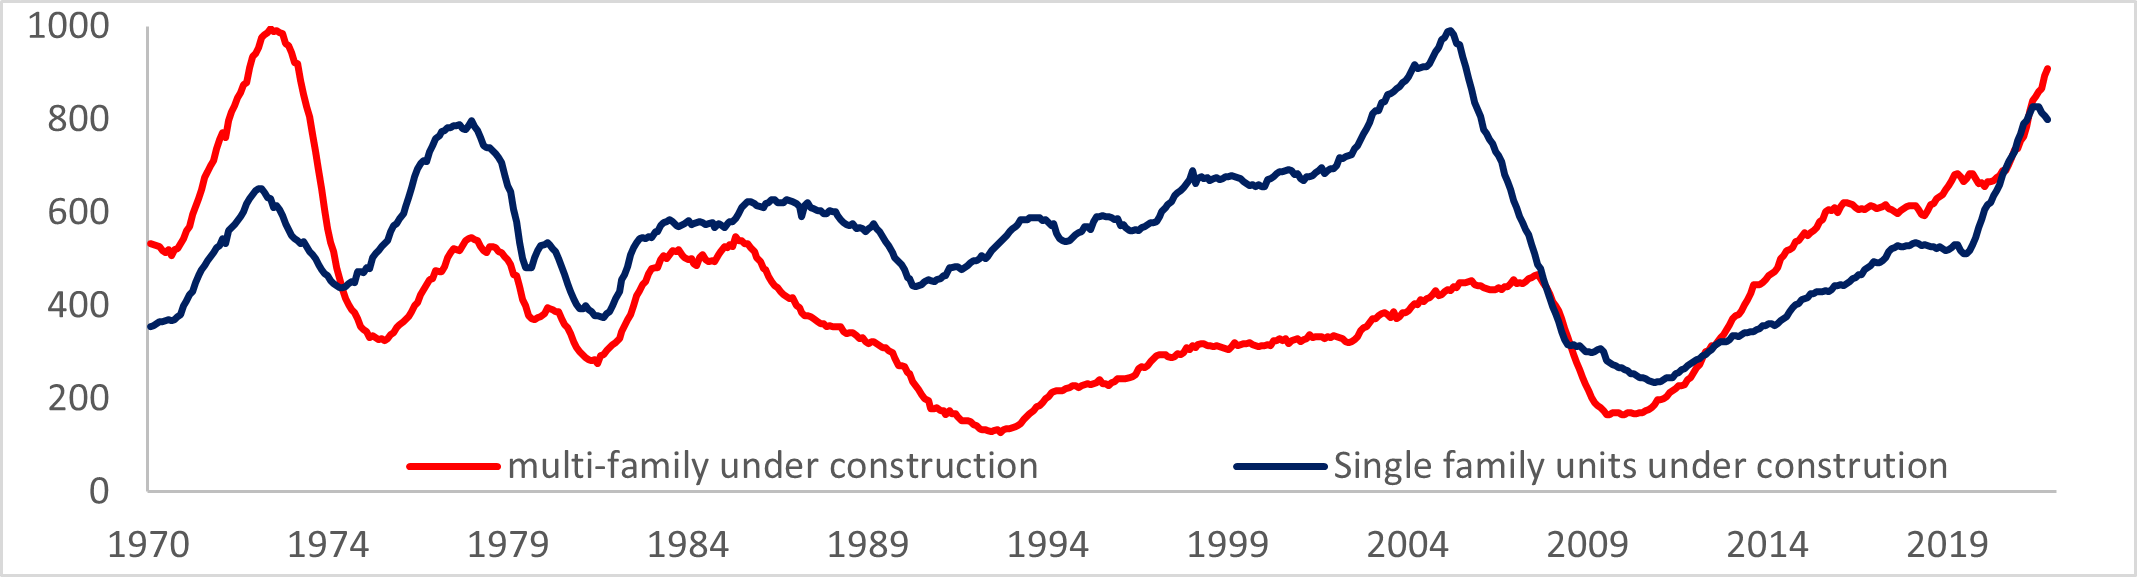
U.S. Construction building a bigger problem
According to MBA, the average 30- year mortgage rate rose 6.92%, and mortgage applications for home purchases fell considerably, almost 4%.
Increase in permits following continued strong demand for rental units, while single-home family permits declined to the lowest since the pandemic. More units are currently under construction than at any time since 1974; this does not seem to bode well for multifamily construction.
Kainos ir valiuta
10 metų trukmės iždo obligacija yra Jungtinių Valstijų vyriausybės išleistas skolinis įsipareigojimas, kurio terminas yra 10 metų nuo pradinės emisijos. Už 10 metų iždo obligaciją kas šešis mėnesius mokamos fiksuotos palūkanų normos palūkanos, o suėjus terminui sumokama jo nominalioji vertė. 10 metų iždo pajamingumas 4.221% 4.95% (5D)
JAV dolerio indeksas yra JAV dolerio vertės matas, palyginti su užsienio valiutų krepšeliu. DXY 111.875 -1.12% (5D)
Unparalleled moves in the fixed-income market
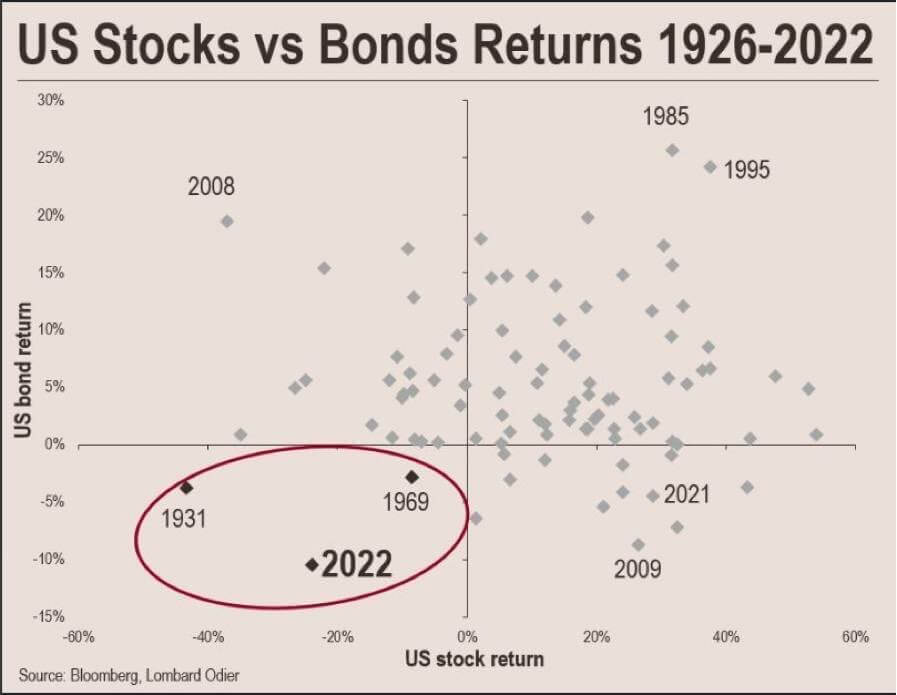
2022 has been an unprecedented year for asset performance; the 60/40 portfolio year to date is the worse performance in 100 years, according to BofA, even worse than the global depression of 1929.
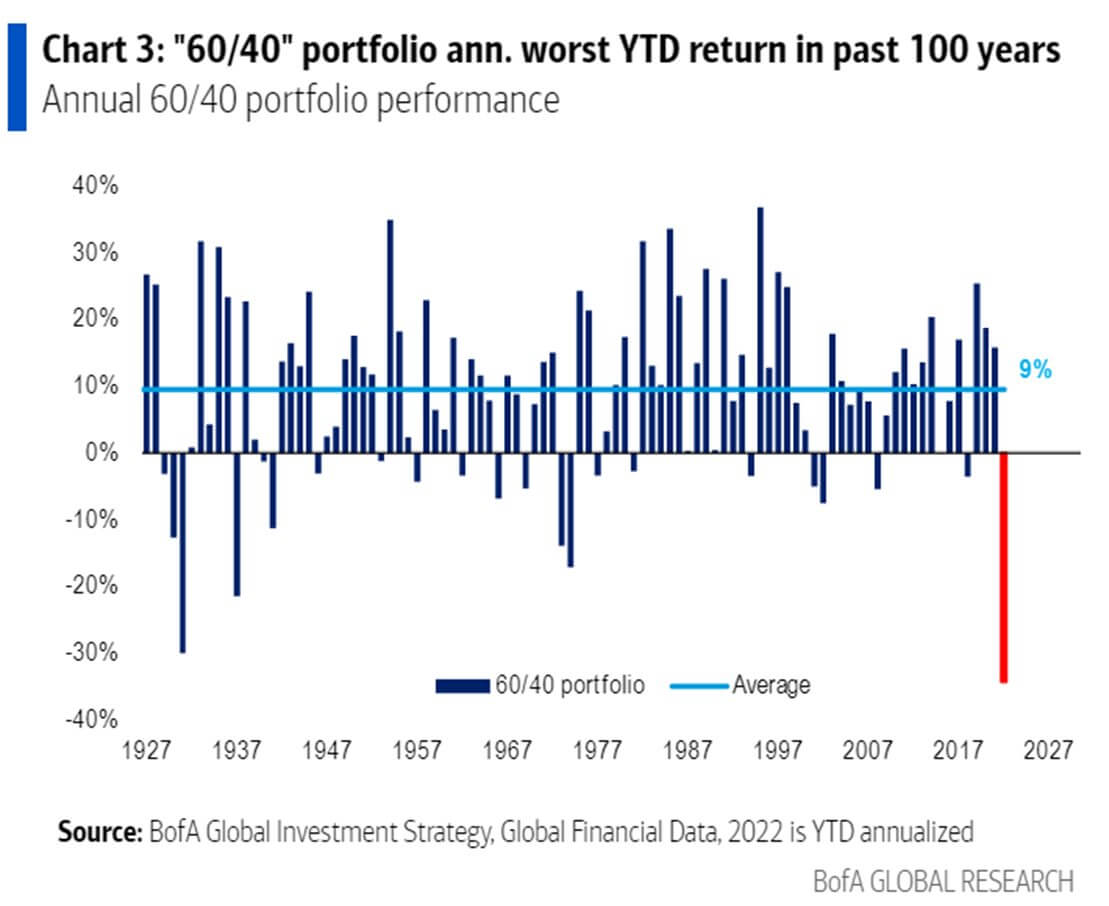
So far, in 2022, the U.S stock and bond market has lost a combined value of nearly $60 trillion. The last time the U.S. markets faced a drawdown of this severity, the U.S. government defaulted its gold peg within the next two years.
In 1933, executive order 6102 required all persons to deliver gold bullion to the Federal Reserve for $20.67 per troy ounce. The U.S had been on a gold standard since 1879, but the Great Depression in the 1930s frightened the public into hoarding gold.
Second, in 1971, during the Nixon shock, President Nixon closed the gold window 1971, the convertibility of U.S dollars into gold, to address the country’s inflation problem and to discourage foreign governments from redeeming more dollars for gold.
Bitcoin apžvalga
Bitcoin (BTC) kaina USD. Bitcoin Kaina $19,160 -1.93% (5D)
Bendros Bitcoin rinkos ribos matas, palyginti su didesne kriptovaliutų rinkos riba. Bitcoin dominavimas 41.93% 0.36% (5D)
- Bitcoin hash rate continued to soar – 260 EH/S
- Futures open interest denominated in BTC hits 650k
- Difficulty projected to increase by 3%
- Asia trade premium at its highest since the last bear market in 2019-2020
Adresai
Pagrindinės tinklo adresų metrikos rinkinys.
Unikalių adresų, kurie tinkle buvo aktyvūs kaip siuntėjas arba gavėjas, skaičius. Skaičiuojami tik tie adresai, kurie buvo aktyvūs vykdant sėkmingas operacijas. Aktyvūs adresai 889,323 3.64% (5D)
Unikalių adresų, kurie pirmą kartą pasirodė atliekant vietinės monetos operaciją tinkle, skaičius. Nauji adresai 406,205 1.97% (5D)
Unikalių adresų, turinčių 1 BTC arba mažiau, skaičius. Adresai su ≥ 1 BTC 908,988 0.40% (5D)
Unikalių adresų, turinčių bent 1 XNUMX BTC, skaičius. Adresai, kurių likutis ≤ 1k BTC 2,128 0.52% (5D)
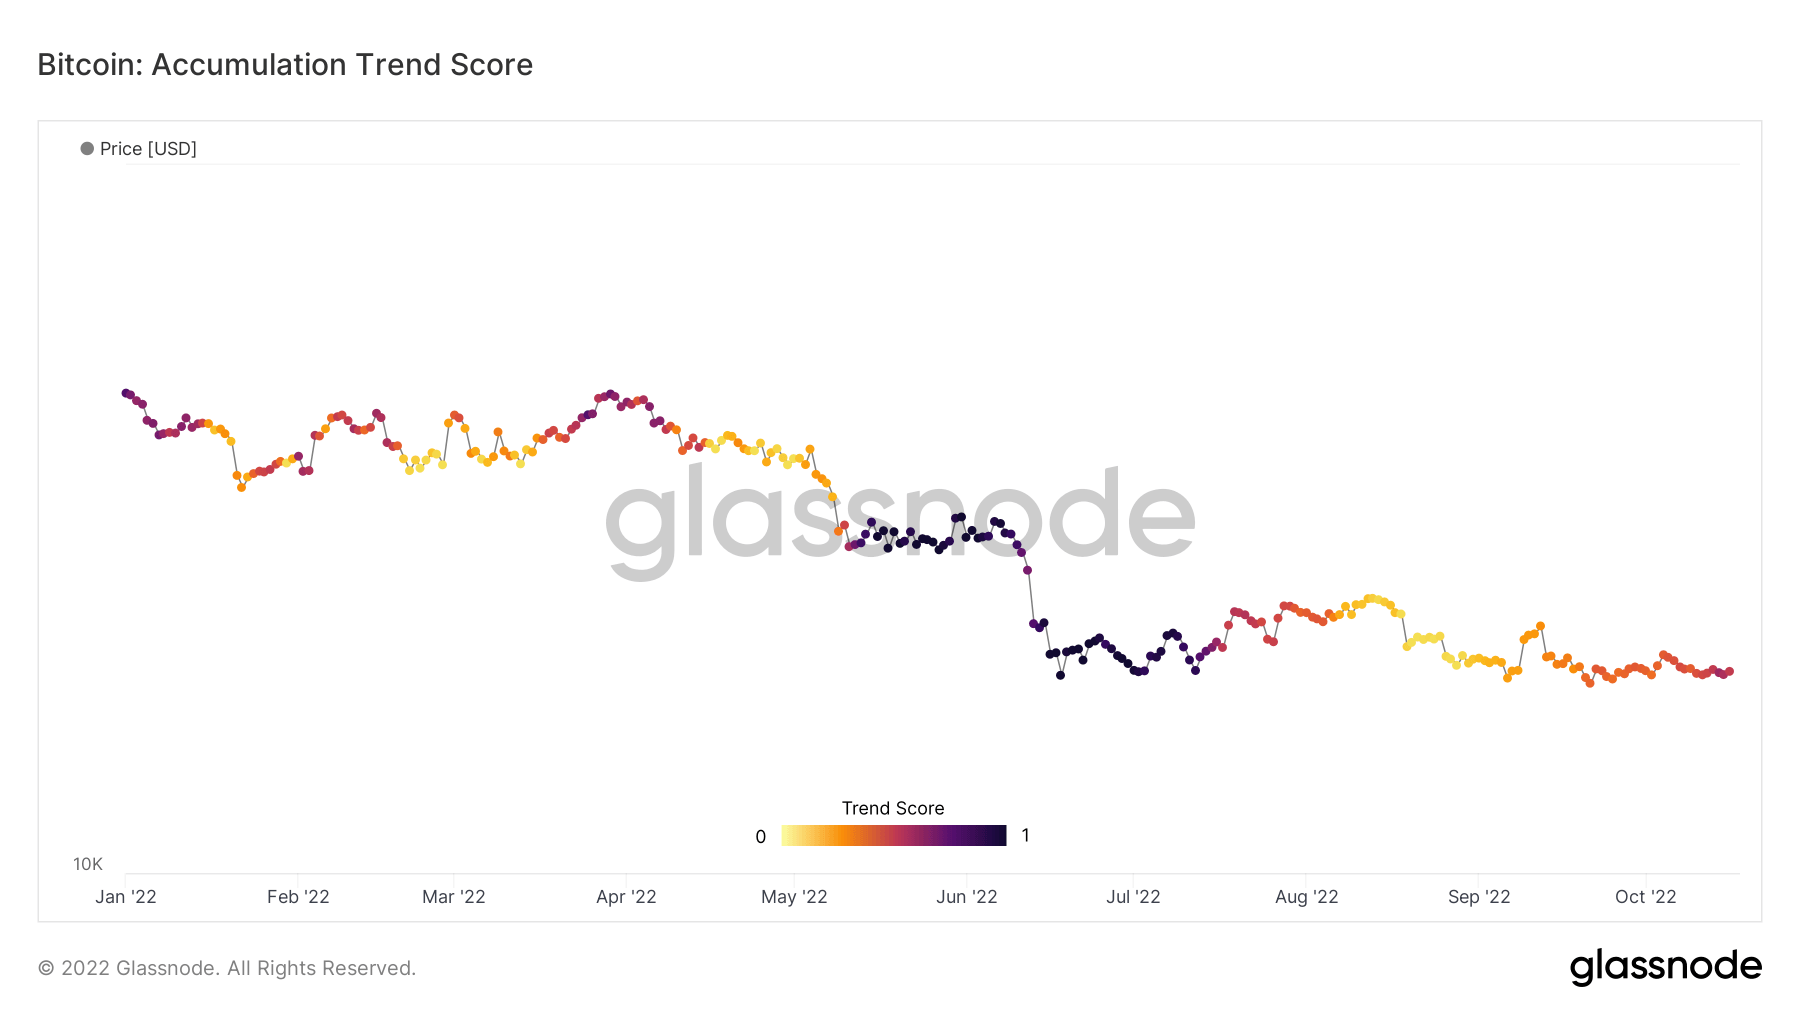
Net accumulation for the first time since July
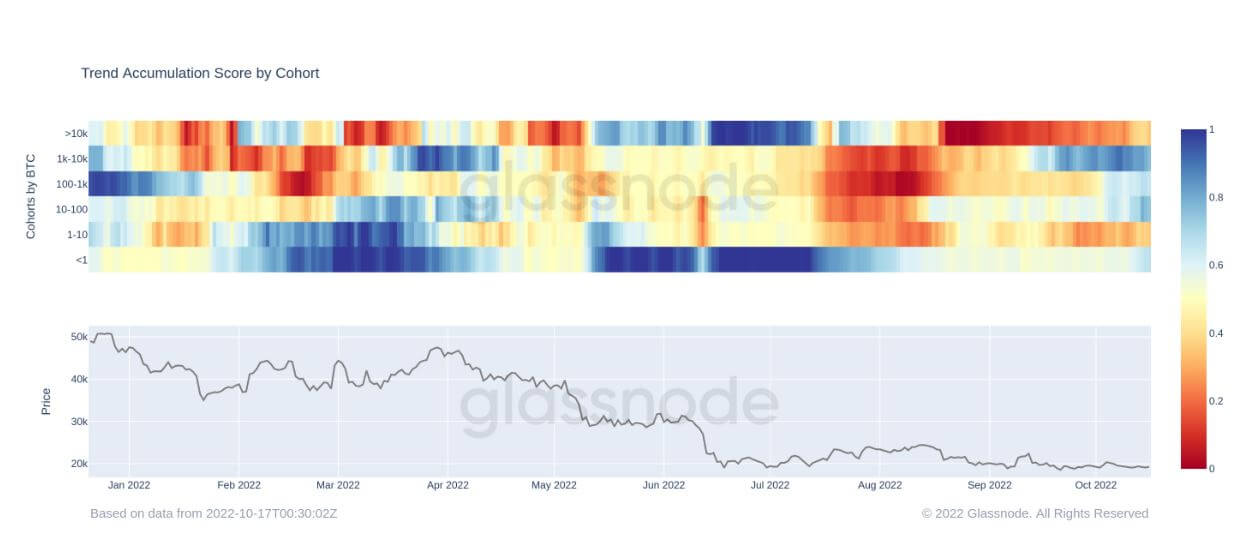
The Accumulation Trend Score is an indicator that reflects the relative size of entities that are actively accumulating coins on-chain in terms of their BTC holdings. The scale of the Accumulation Trend Score represents both the size of the entities balance (their participation score) and the amount of new coins they have acquired/sold over the last month (their balance change score).
An Accumulation Trend Score of closer to 1 indicates that, on aggregate, larger entities (or a big part of the network) are accumulating, and a value more relative to 0 means they are distributing or not accumulating. This provides insight into the balance size of market participants and their accumulation behavior over the last month.
Since the beginning of August, the Bitcoin ecosystem has seen net distributors due to fear around the macro uncertainty with traditional finance assets getting hammered. However, since then, BTC has stayed relatively flat, hovering around the $20k mark, which has been encouraging to see and has most likely alerted wall street that this asset is here to stay.
By looking at the cohorts below, a number of them are accumulating again, such as whales between 1k-10k BTC and retail with less than 1 BTC. Whales that hold 10k BTC or more are still net sellers but have turned into more of an orange than a red, which shows their distribution is being reduced and less selling pressure has occurred.
Dariniai
Išvestinė finansinė priemonė yra dviejų šalių sutartis, kurios vertė / kaina nustatoma iš pagrindinio turto. Dažniausios išvestinių finansinių priemonių rūšys yra ateities sandoriai, opcionai ir apsikeitimo sandoriai. Tai finansinė priemonė, kurios vertę / kainą nustato iš pagrindinio turto.
Bendra lėšų suma (USD vertė), skirta atviriems ateities sandoriams. Atviras ateities sandoris $ 12.68B 5.20% (5D)
Bendra ateities sandorių apimtis (USD vertė) per paskutines 24 valandas. Ateities tomas $ 24.35B $153.29 (5D)
Likviduota suma (USD vertė) iš trumpųjų pozicijų ateities sandoriuose. Iš viso ilgo likvidavimo $ 42.01M $0 (5D)
Likviduota suma (USD vertė) iš ilgųjų ateities sandorių pozicijų. Iš viso trumpi likvidavimai $ 42.01M $ 3.25M (5D)
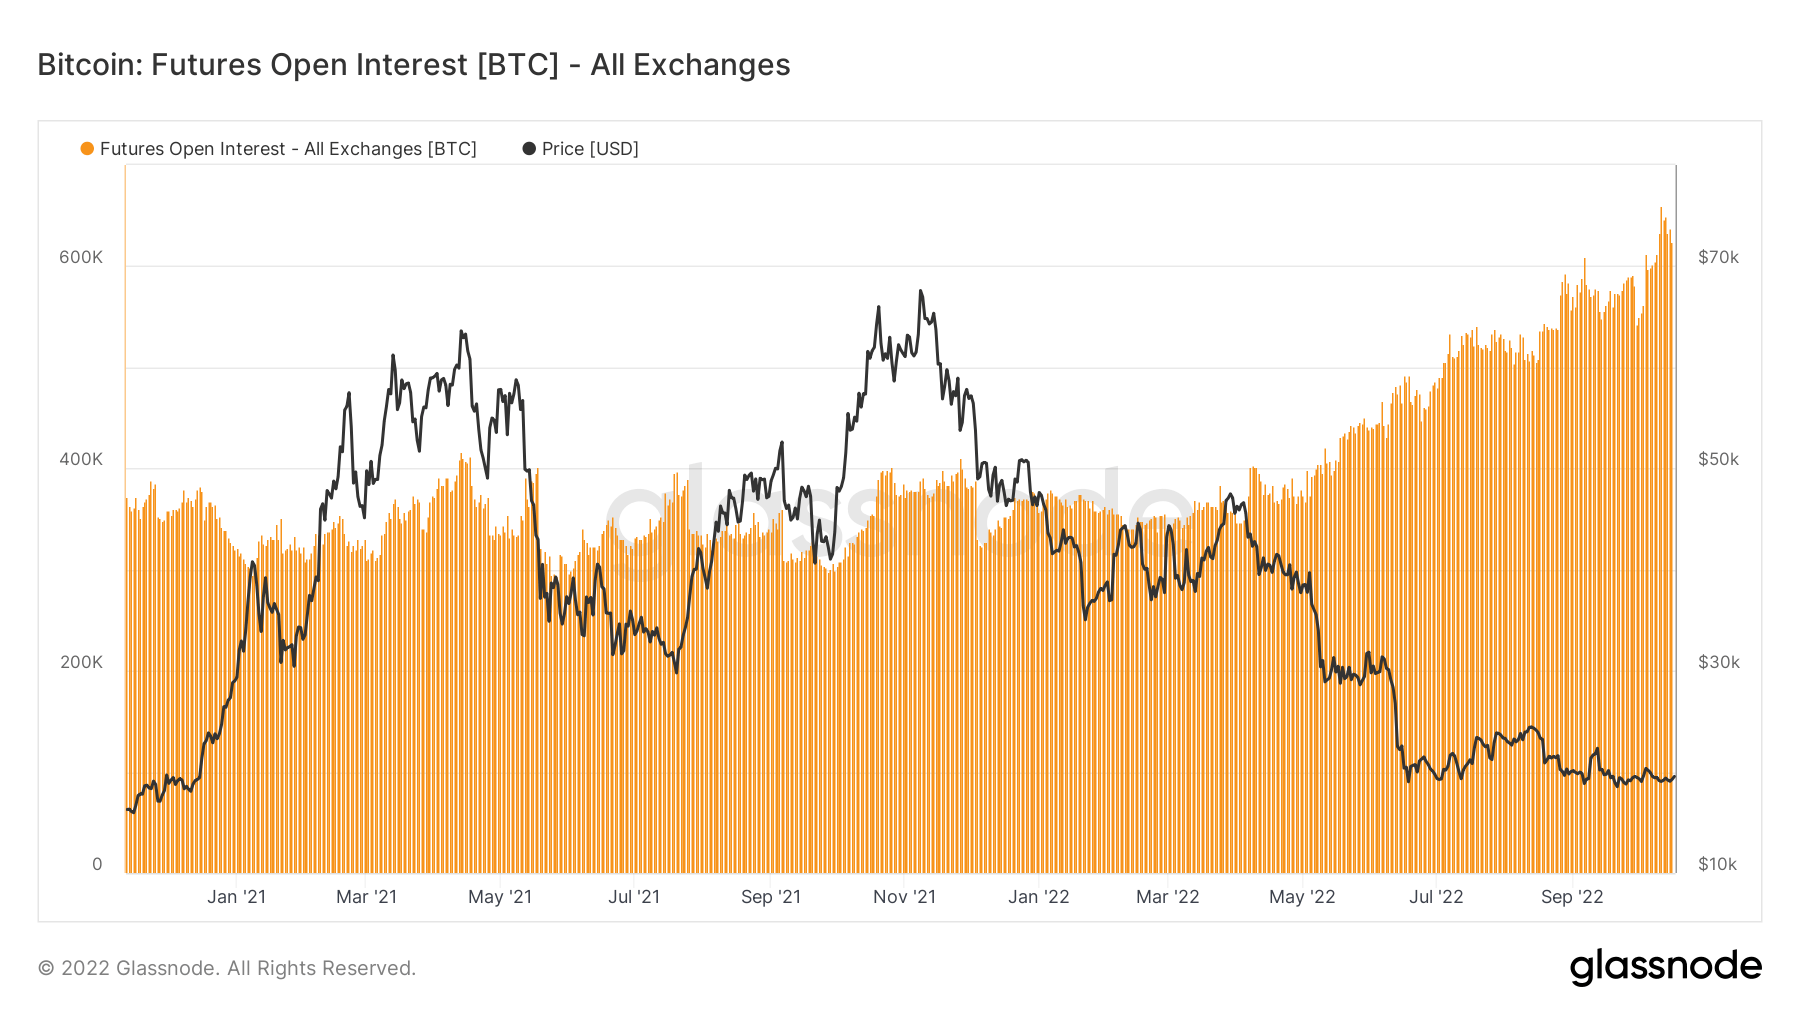
Futures open interest at all-time highs denominated in Bitcoin
Futures’ open interest, the total amount of (USD value) allocated in available futures contracts, has hit an all-time high. This tells us that levels of speculation within the market are increasing, despite Bitcoin falling over 70% from its all-time high.
Futures open interest has stayed relatively flat from January 2021 to May 2022, roughly 350k BTC but has soared to 640k denominated in Bitcoin futures open interest.
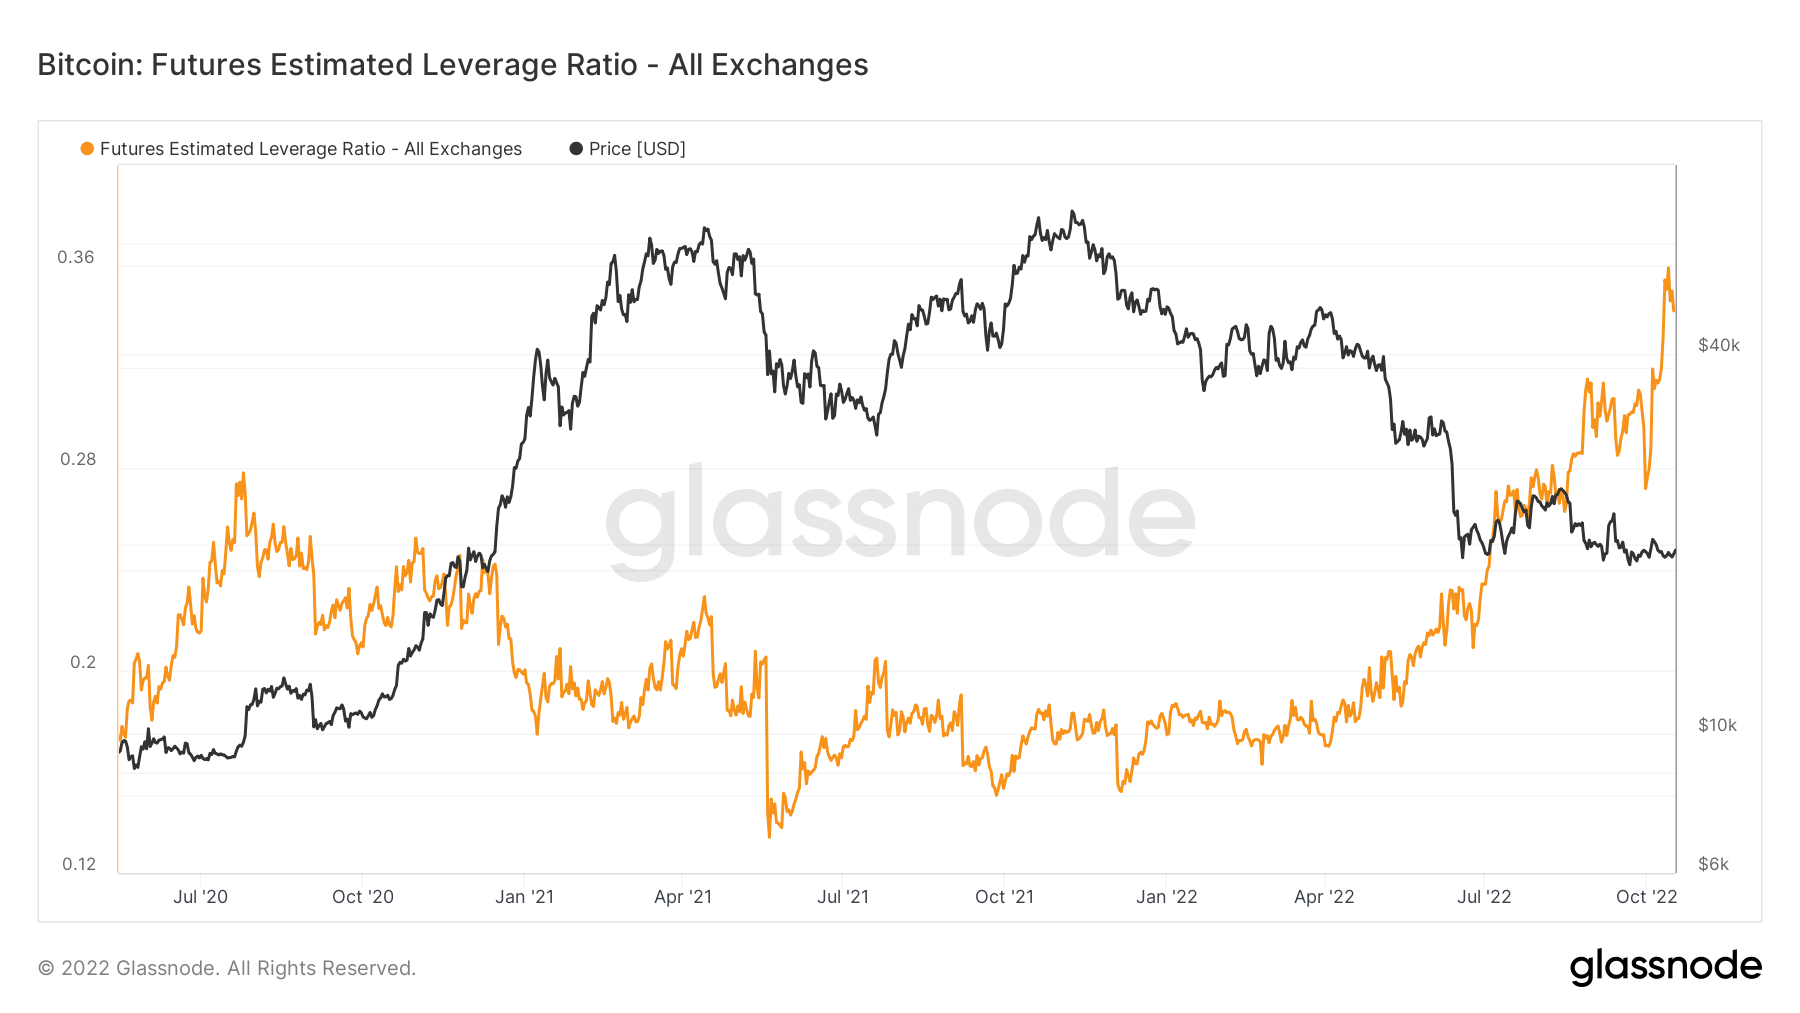
Leverage continues to increase
The Estimated Leverage Ratio is defined as the ratio of the open interest in futures contracts and the balance of the corresponding exchange.
From May 2020 to May 2022, the ELR has stayed in a constant range of around 0.17 to 0.25; however, since June 2022, the ELR has seen a remarkable climb. The ELR is at an all-time high, and a significant amount of leverage needs to be unwound. The BTC ecosystem has low liquidity right now due to being in a bear market while a substantial amount of cash remains on the sidelines; expect to see this leverage start to come down.
Kalnakasiai
Pagrindinės kasybos metrikos, susijusios su maišos galia, pajamomis ir blokų gamyba, apžvalga.
Vidutinis apskaičiuotas maišos skaičius per sekundę, kurį tinkle sukuria kalnakasiai. Maišos norma 262 TH / s 2.34% (5D)
Dabartinis apskaičiuotas maišos, reikalingos blokui išgauti, skaičius. Pastaba: Bitcoin sunkumas dažnai žymimas kaip santykinis sunkumas genezės bloko atžvilgiu, kuriam reikėjo maždaug 2^32 maišos. Norint geriau palyginti blokų grandines, mūsų vertės žymimos neapdorotomis maišomis. Sunkumas 152 T 13.43% (14D)
Bendras kiekis, laikomas kalnakasių adresais. Miner Balance 1,830,490 BTC -0.20% (5D)
Bendras monetų kiekis, perduotas iš kalnakasių į mainų pinigines. Skaičiuojami tik tiesioginiai pervedimai. Miner grynosios padėties pakeitimas -23,592 XNUMX XNUMX BTC -14,681 XNUMX XNUMX BTC (5D)
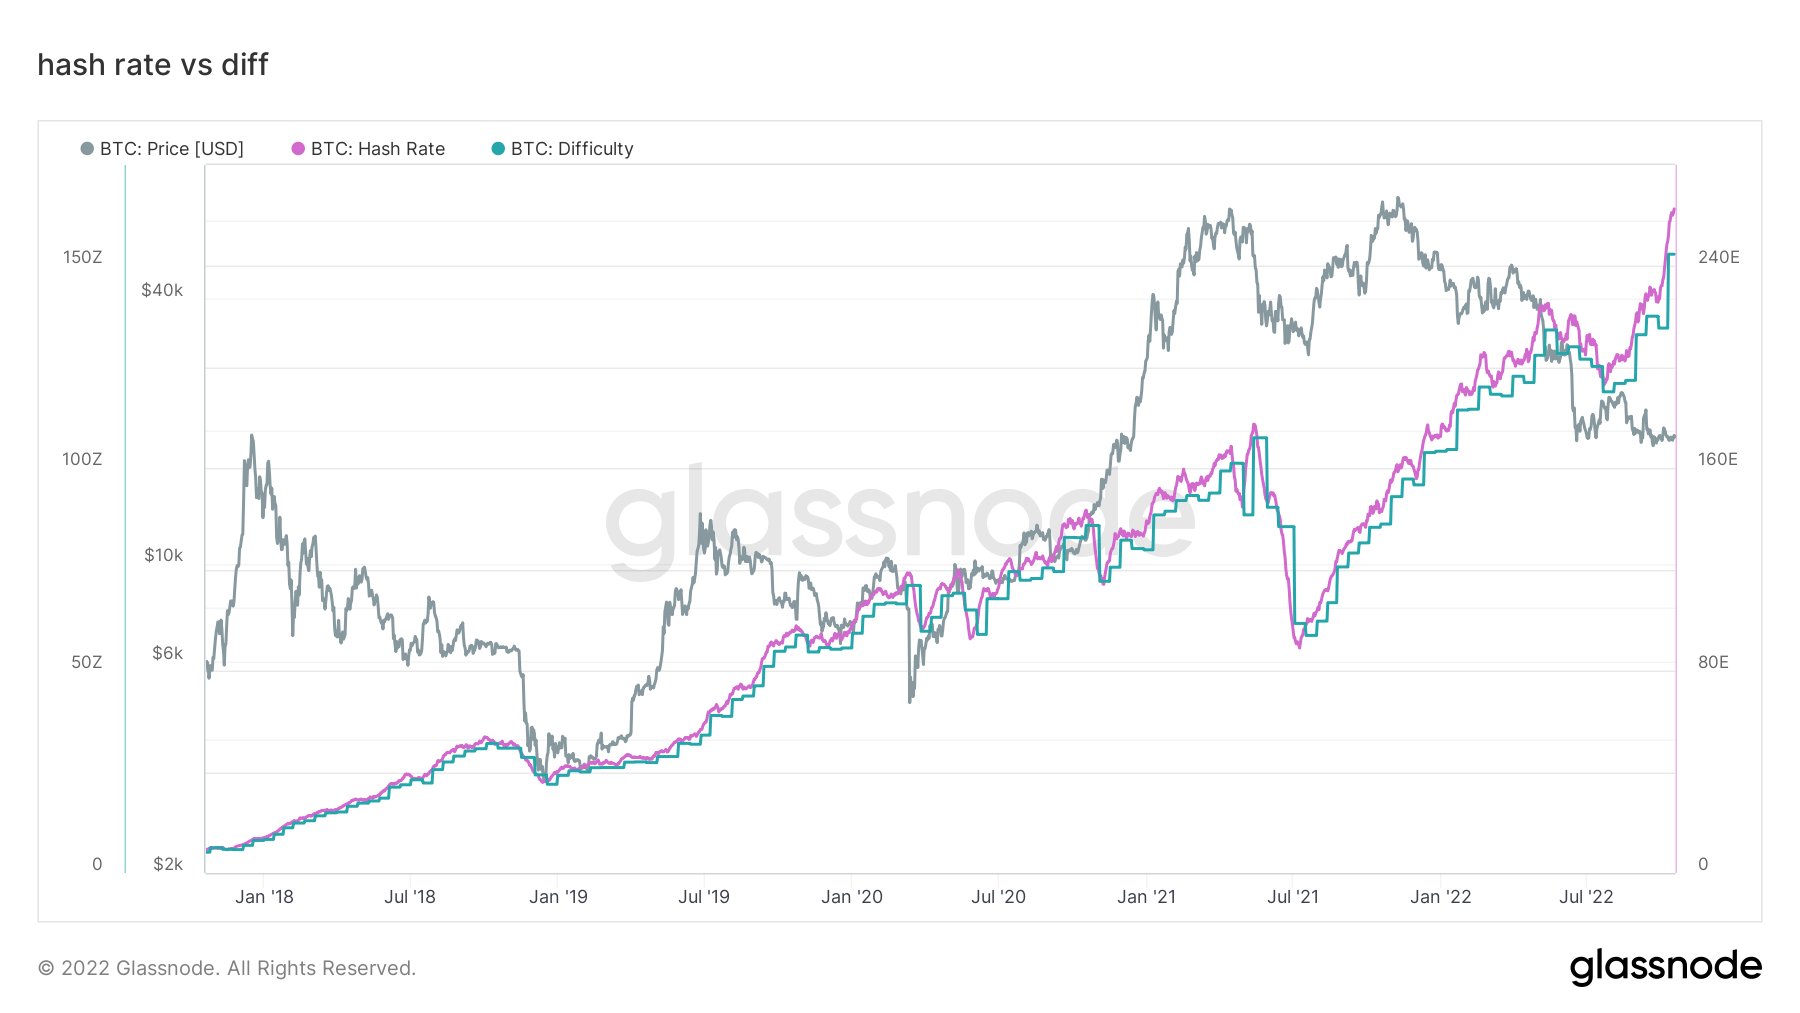
Miners continue to get squeezed
Throughout August to October, the hash rate has gone exponential, from 220 EH/S up to 260 EH/s, this is unheard of during a bear market, and difficulty is playing catch up, which is also at an all-time high, continuing to squeeze miner revenue. When the next difficulty epoch is completed, it is projected to adjust another 3% to the upside. A distant memory of May 2021, when China banned mining and saw the network drop to 84 EH/S.
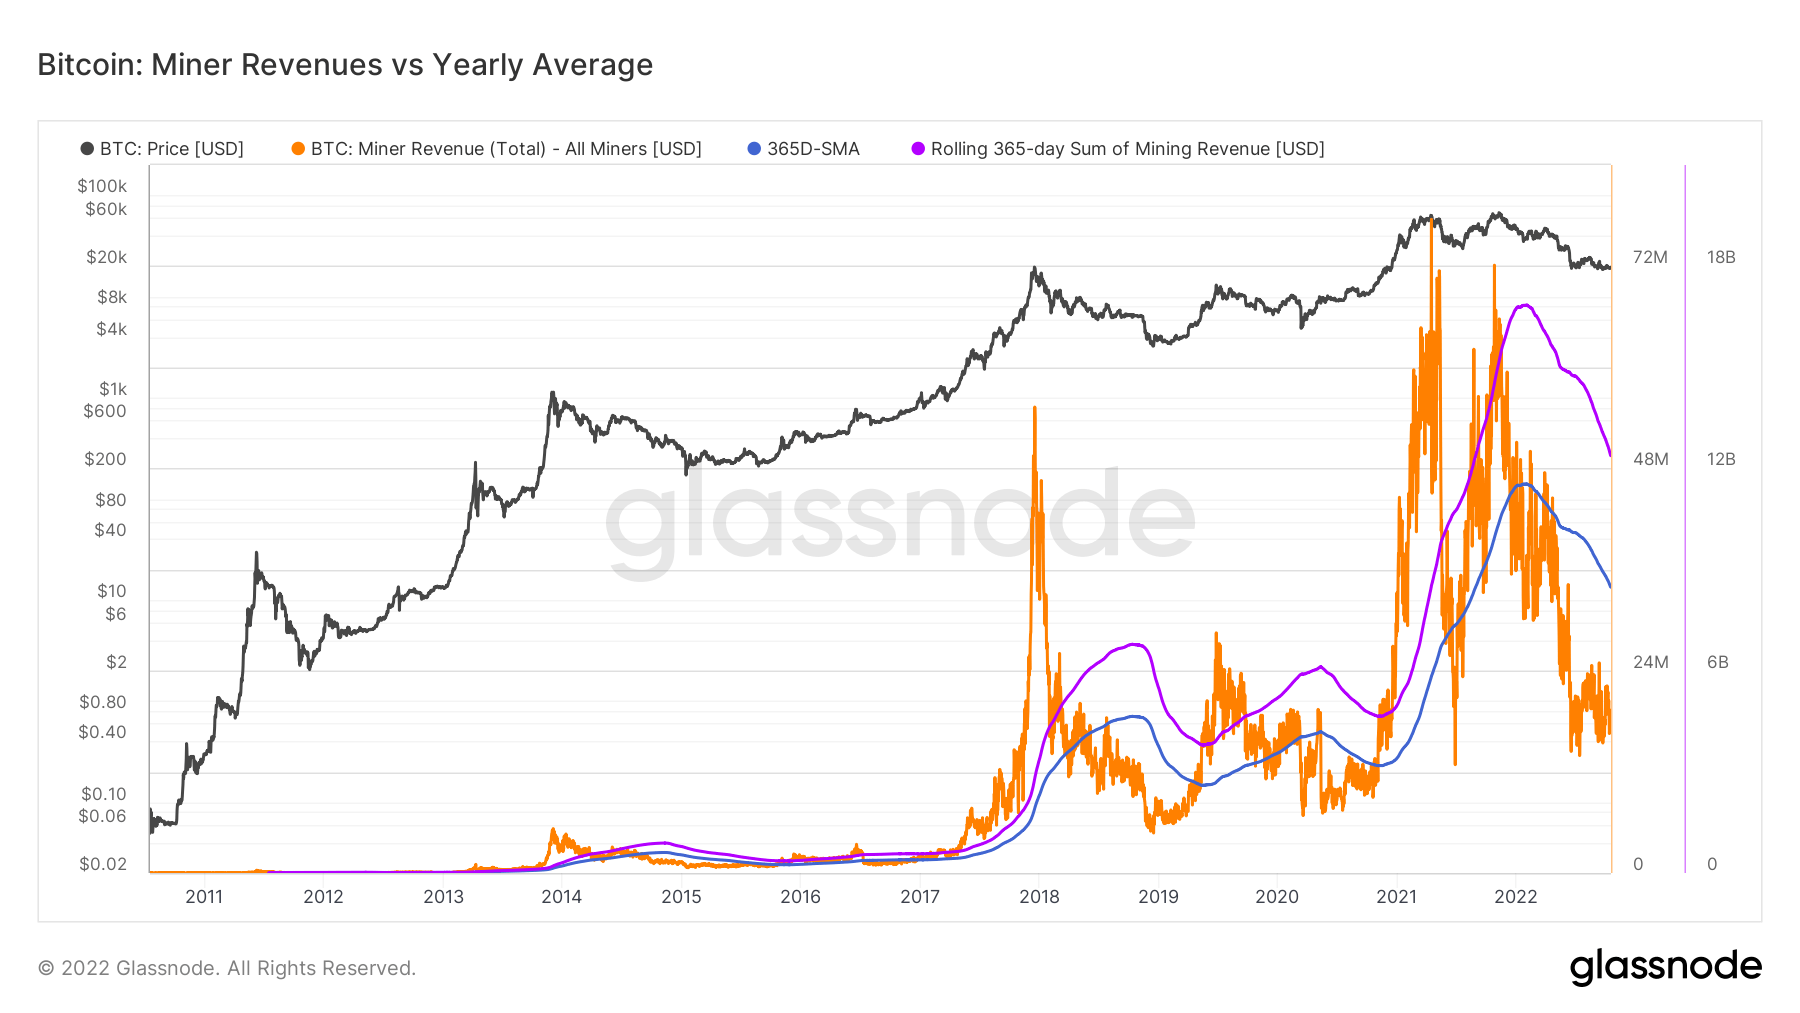
To contextualize the stress miners are under and the lack of revenue they are incurring is the metric below miner revenue vs. the yearly average. Demonstrates the daily USD revenue paid to BTC miners in orange and compare it to the 365-day moving average. While also observing the aggregate industry income on a rolling 365-day sum of miner revenues.
Veikla grandinėje
Grandininės metrikos, susijusios su centralizuota mainų veikla, rinkimas.
Bendras monetų, laikomų mainų adresais, kiekis. Keitimo balansas 2,343,473 BTC -57,299 XNUMX XNUMX BTC (5D)
Mainų piniginėse laikomų atsargų keitimas 30 dienų. Keisti grynąją poziciją 281,432 BTC -395,437 XNUMX XNUMX BTC (30D)
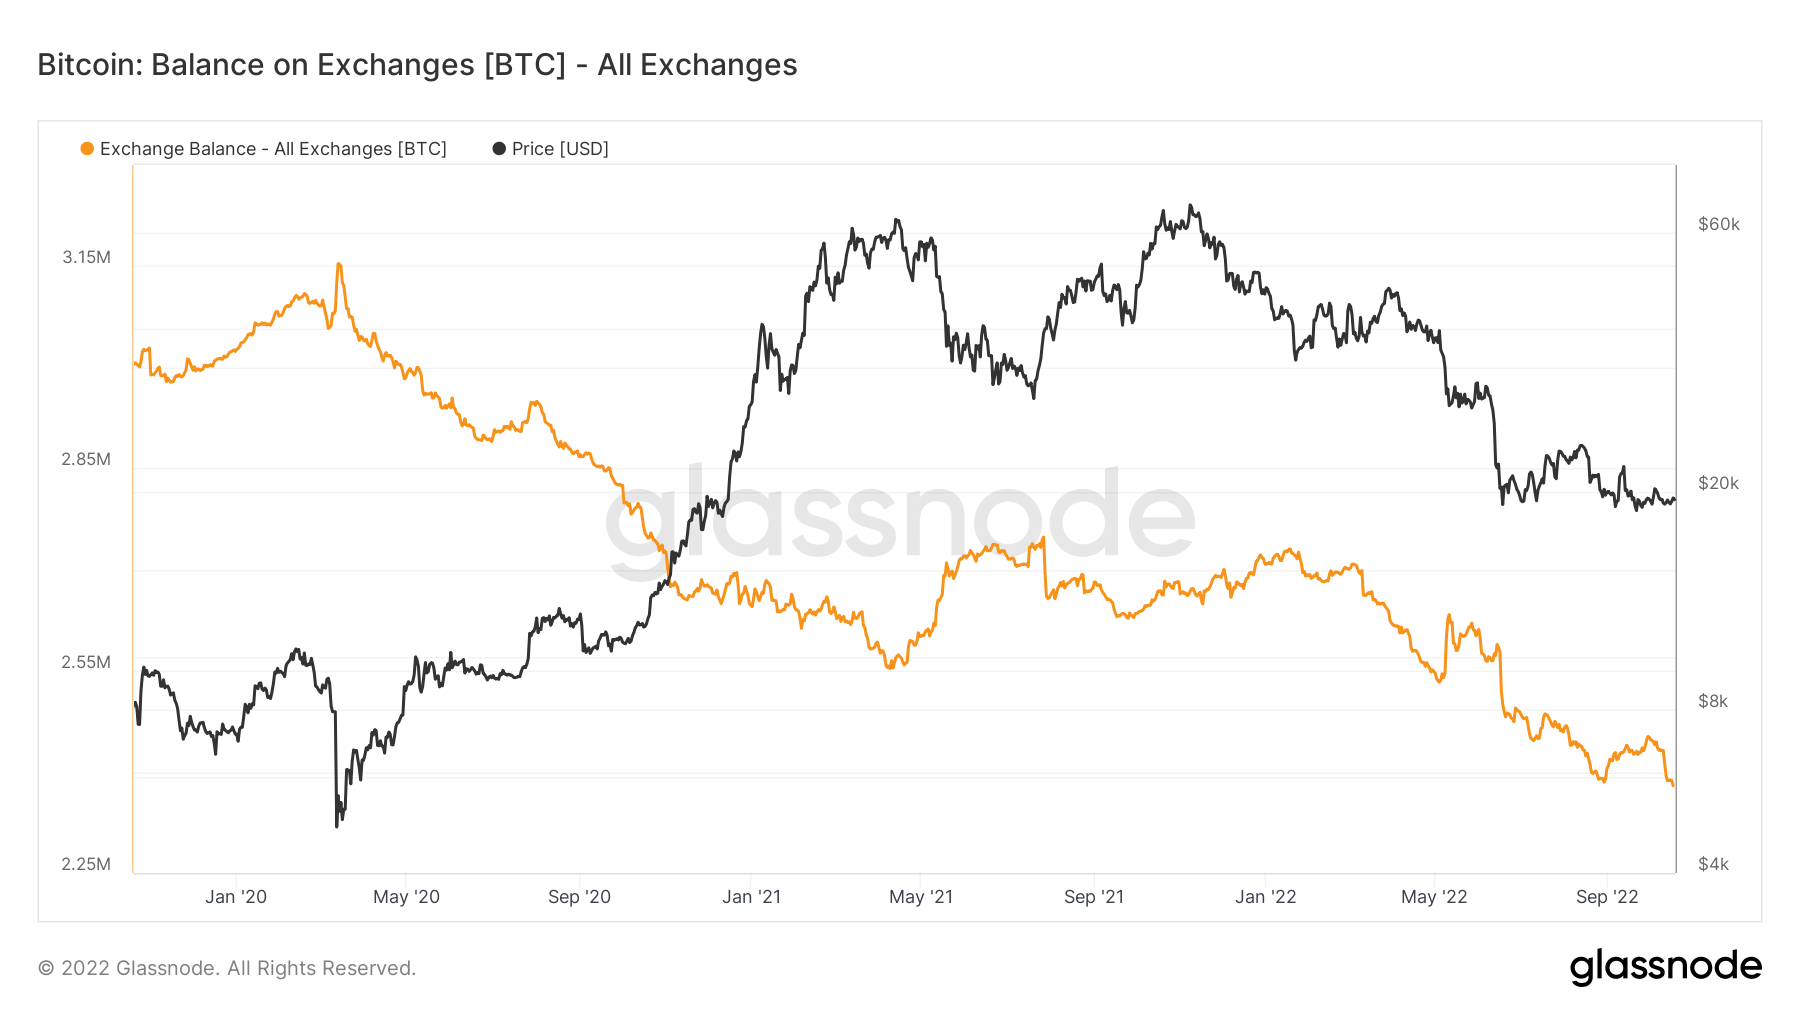
Bitcoin held on exchanges reached its lowest in 4 years
Biržų turimas bitkoinas pasiekė žemiausią lygį per ketverius metus. Šiuo metu biržose laikoma Bitcoin suma yra šiek tiek mažesnė nei 2,4 mln. USD, o tai rodo oranžinė linija toliau pateiktoje diagramoje.
Over 300,000 Bitcoins have been removed from the exchanges during winter, indicating a bullish trend among investors. This lowered the supply held by exchanges to its 4-year lowest. The last time the Bitcoin balance on exchanges was around $2,4 million was in late 2018.
Dabartiniai 2,4 milijono USD, laikomi biržose, sudaro maždaug 12% visos Bitcoin pasiūlos rinkoje.
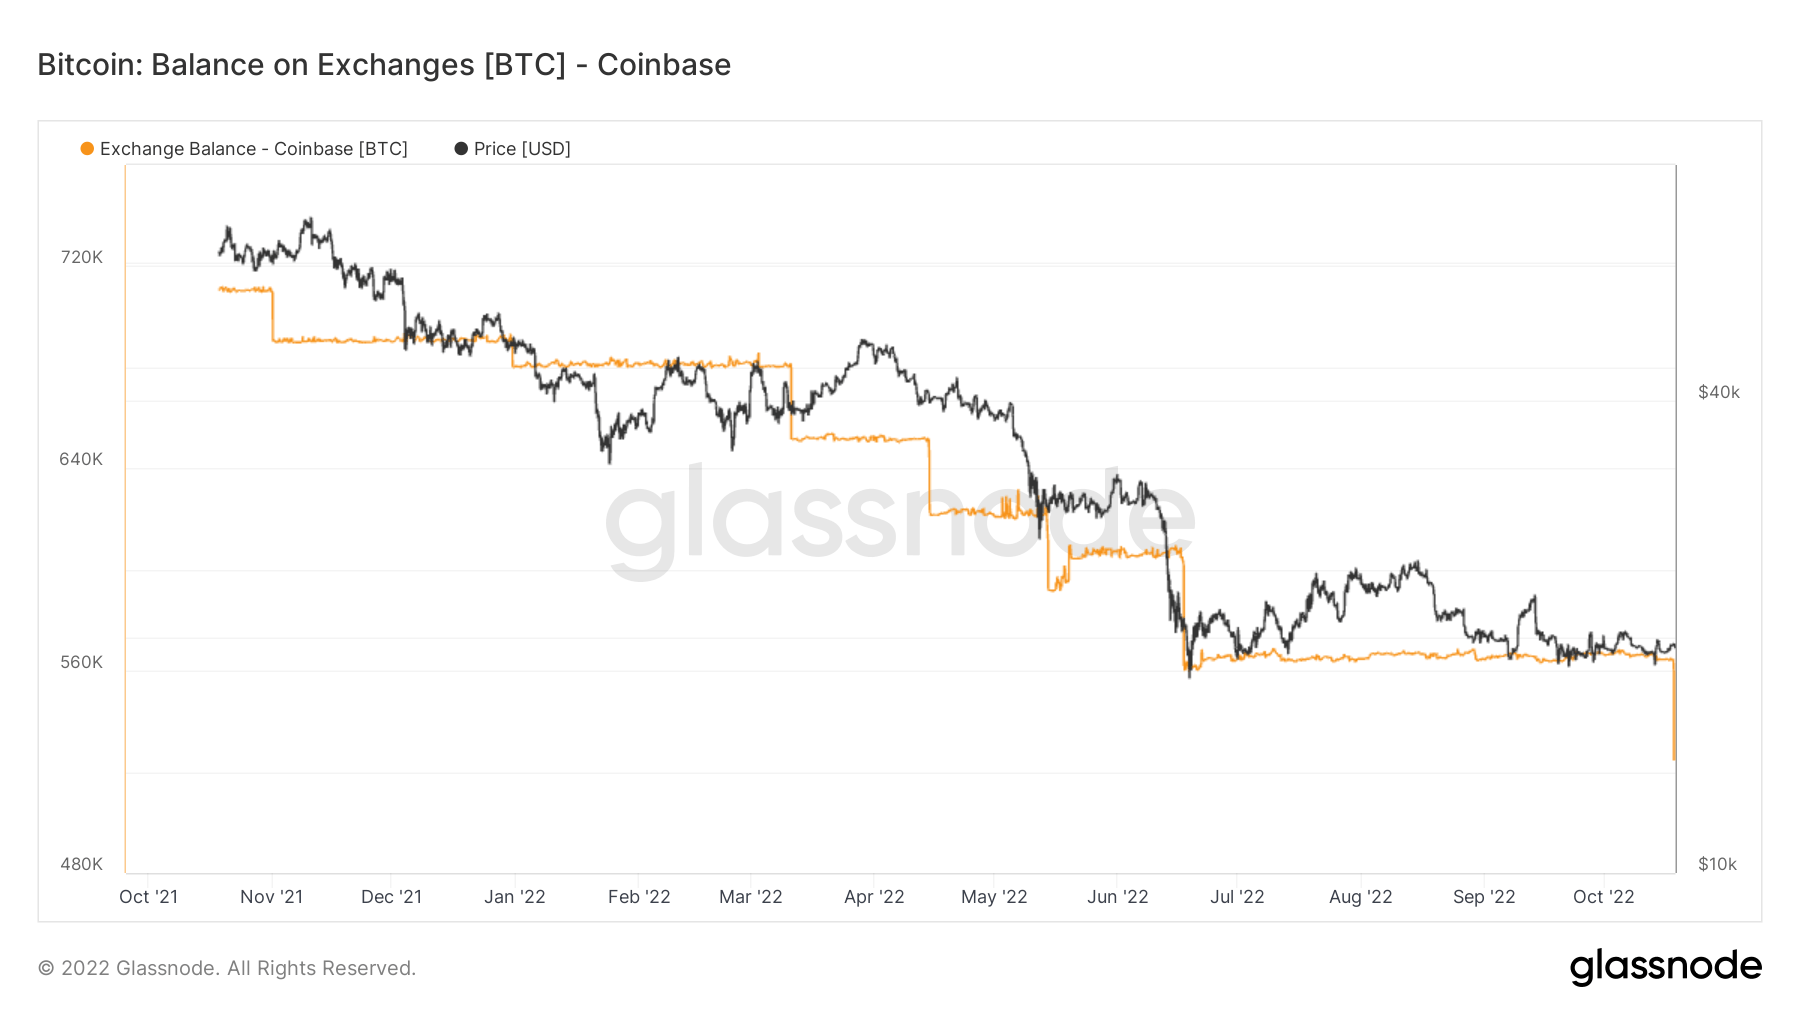
Since the November 2021 bull run, a minimal amount of Bitcoins were released back onto the exchange. At the time, Coinbase held almost 4% of the total Bitcoin supply. The exchange lost 1% of total Bitcoin in nearly a year and has just under 3% of it.
Coinbase pirmiausia naudoja didelės JAV institucijos, kurios yra žinomos dėl savo tendencijos pirkti ir laikyti. Kaip taip pat parodyta aukščiau esančioje diagramoje, birža prarado nemažą Bitcoin kiekį po to, kai smogė meškų rinkai.
Coinbase HAD metų pradžioje beveik 680,000 560,000 bitkoinų, o per aštuonis rugpjūčio mėnesius šis skaičius sumažėjo iki XNUMX XNUMX. Mainai prarastas dar 50,000 18 bitkoinų spalio 525,000 d., todėl bendra Coinbase turima suma sumažėjo iki XNUMX XNUMX.
Geografinis suskirstymas
Regioninės kainos sudaromos dviem etapais: pirma, kainų pokyčiai priskiriami regionams pagal darbo valandas JAV, Europoje ir Azijoje. Tada regioninės kainos nustatomos apskaičiuojant suminę kiekvieno regiono kainų pokyčių laikui bėgant sumą.
Ši metrika rodo regioninės kainos pokytį per 30 dienų Azijos darbo valandomis, ty nuo 8 iki 8 val. Kinijos standartiniu laiku (00:00–12:00 UTC). Azija 3,724 BTC -2,159 XNUMX XNUMX BTC (5D)
Ši metrika rodo regioninės kainos, nustatytos ES darbo valandomis, pokytį per 30 dienų, ty nuo 8 iki 8 val. Vidurio Europos laiku (07:00-19:00 UTC), atitinkamai Vidurio Europos vasaros laiku (06:00-18:00). UTC). Europa -3,464 XNUMX XNUMX BTC 4,093 BTC (5D)
Ši metrika rodo regioninės kainos, nustatytos JAV darbo valandomis, pokytį per 30 dienų, ty nuo 8 iki 8 val. Rytų laiku (13:00–01:00 UTC), atitinkamai Rytų vasaros laiku (12:00–0:00 UTC). . JAV -3,445 XNUMX XNUMX BTC 5,721 BTC (5D)
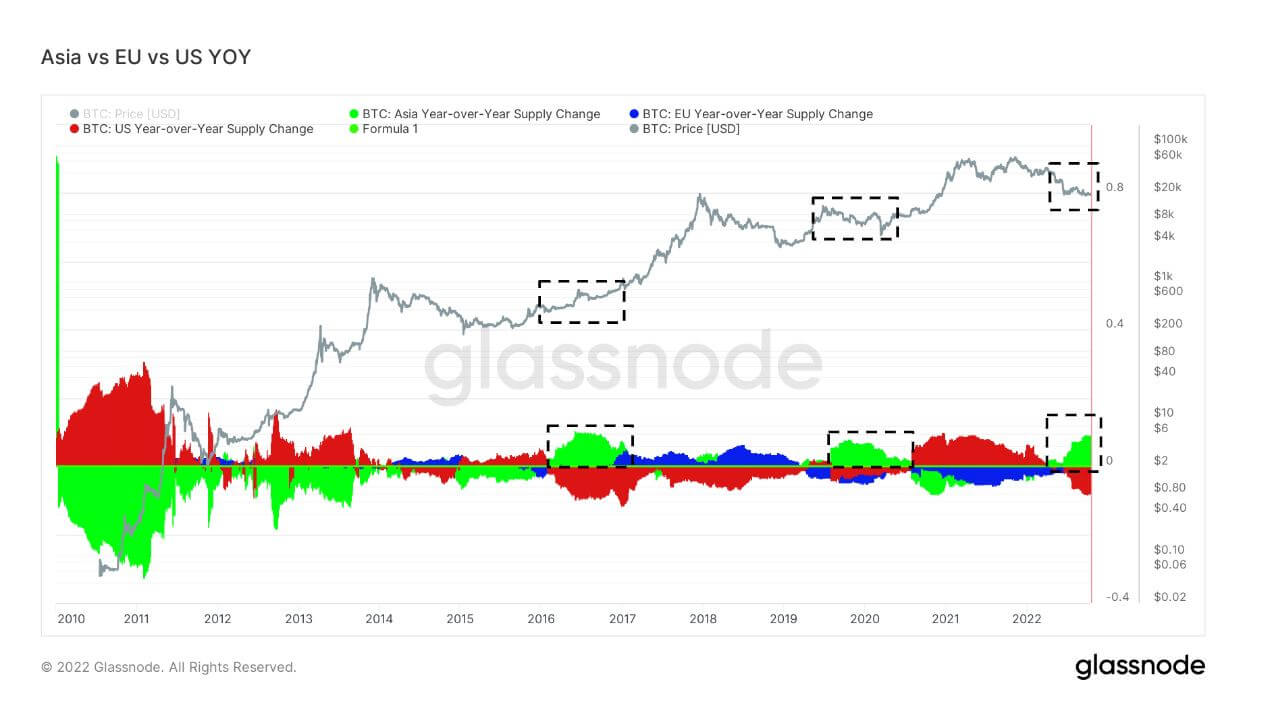
When Asia buys Bitcoin, it’s usually a good time to buy Bitcoin
The last three bear markets, 2016-2017, 2019-2020, and 2022, have seen Asia’s share of BTC ownership go up. This is currently the most significant Asia premium for several years. Cryptoslate has talked about Asia becoming the smart money in the ecosystem. Looking at previous bear markets, it is apparent that Asia scoops up cheap BTC.
Kohortos
Išskaido santykinį elgesį pagal įvairių subjektų piniginę.
SOPR – panaudoto produkcijos pelno koeficientas (SOPR) apskaičiuojamas realizuotą vertę (USD) padalijus iš panaudotos produkcijos vertės sukūrimo metu (USD). Arba paprasčiausiai: parduota / sumokėta kaina. Ilgalaikis laikiklis SOPR 0.50 -16.67% (5D)
Trumpalaikis turėtojas SOPR (STH-SOPR) yra SOPR, kuriame atsižvelgiama tik į išleistus jaunesnius nei 155 dienų rezultatus ir naudojamas kaip rodiklis vertinant trumpalaikių investuotojų elgesį. Trumpalaikis laikiklis SOPR 0.99 -1.00% (5D)
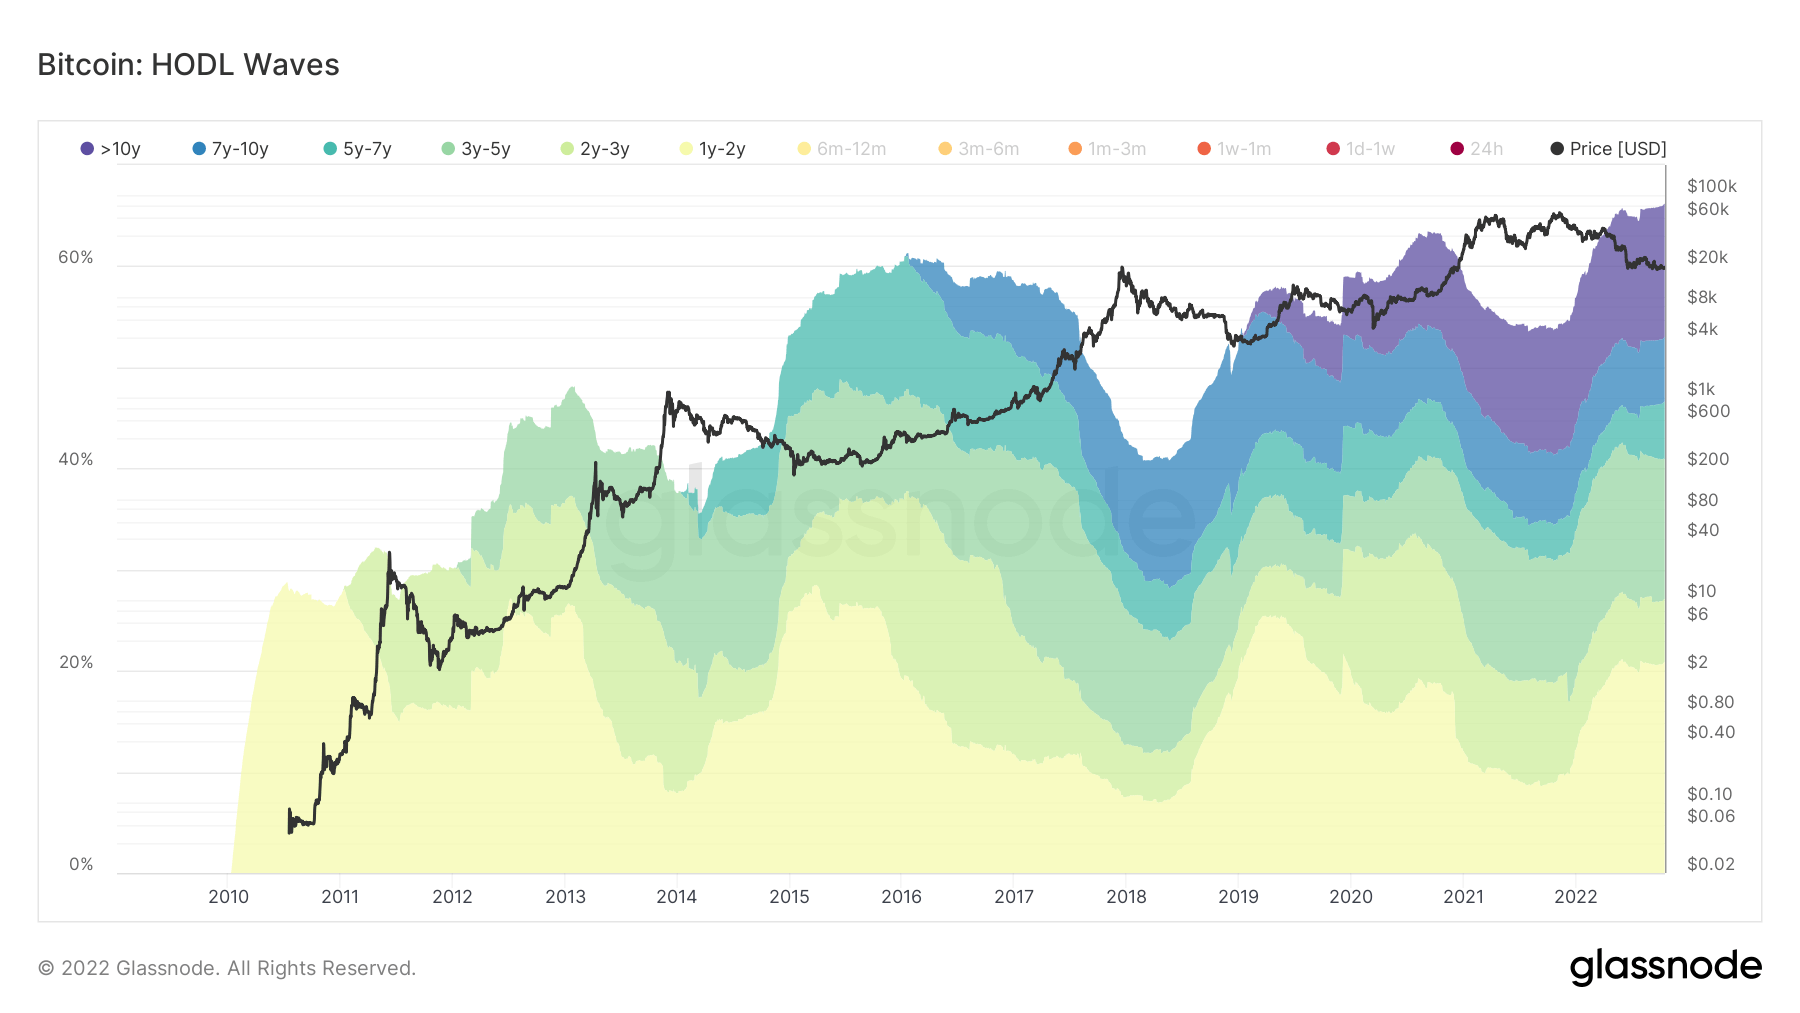
Long-term holders holding down the fort
Long-term holders are defined as a cohort that has held Bitcoin longer than 155 days and is considered to be the smart money of the ecosystem. As BTC’s all-time high came in November 2021, one-year cohorts were selected over six months to show this cohort has held from a 75% drawdown and is still hodling.
During bear market cycles, LTHs accumulate while the price is suppressed after STHs have left the ecosystem as they entered for price speculation. Currently, 66% of the supply is held by LTH, which is the most amount ever; during bear markets, LTH’s collection portion grows, forming the new base for each bear market cycle.
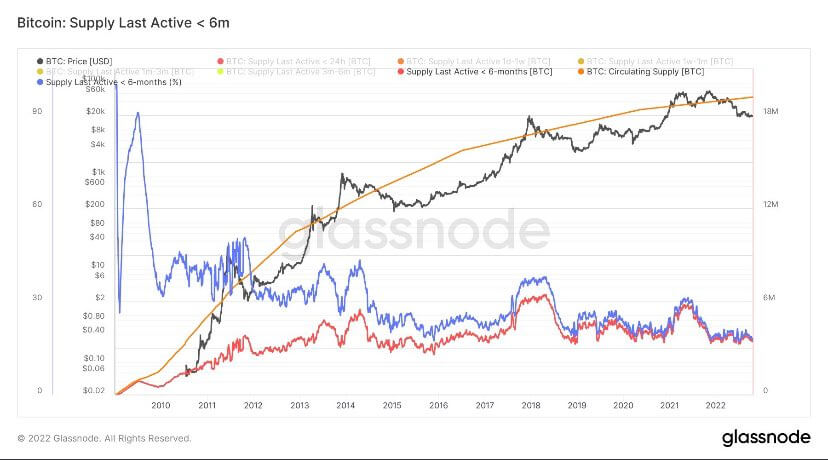
Short-term holders are at bear market lows
Short-term holders (6 months or less) are holding Bitcoin at extremely low levels, similar to previous bear market cycles. STH’s currently have around 3 million of the supply; during the 2021 bull run, this cohort got up to 6 million, and the same can be seen with the last bull run of 2017. Not all STH’s sold for fear of price; a migration occurred from STHs to LTH, which saw an increase of 10 million of the supply to 13 million across the back end of 2021.
Stablecoins
Kriptovaliutos rūšis, kuri yra paremta atsargomis ir todėl gali pasiūlyti kainų stabilumą.
Bendras monetų, laikomų mainų adresais, kiekis. Stablecoin mainų balansas $ 40.14B -0.05% (5D)
Bendra USDC suma, laikoma mainų adresais. USDC biržos balansas $ 1.82B -23.87% (5D)
Bendra USDT suma, laikoma mainų adresais. USDT valiutos likutis $ 17.09B -0.05% (5D)
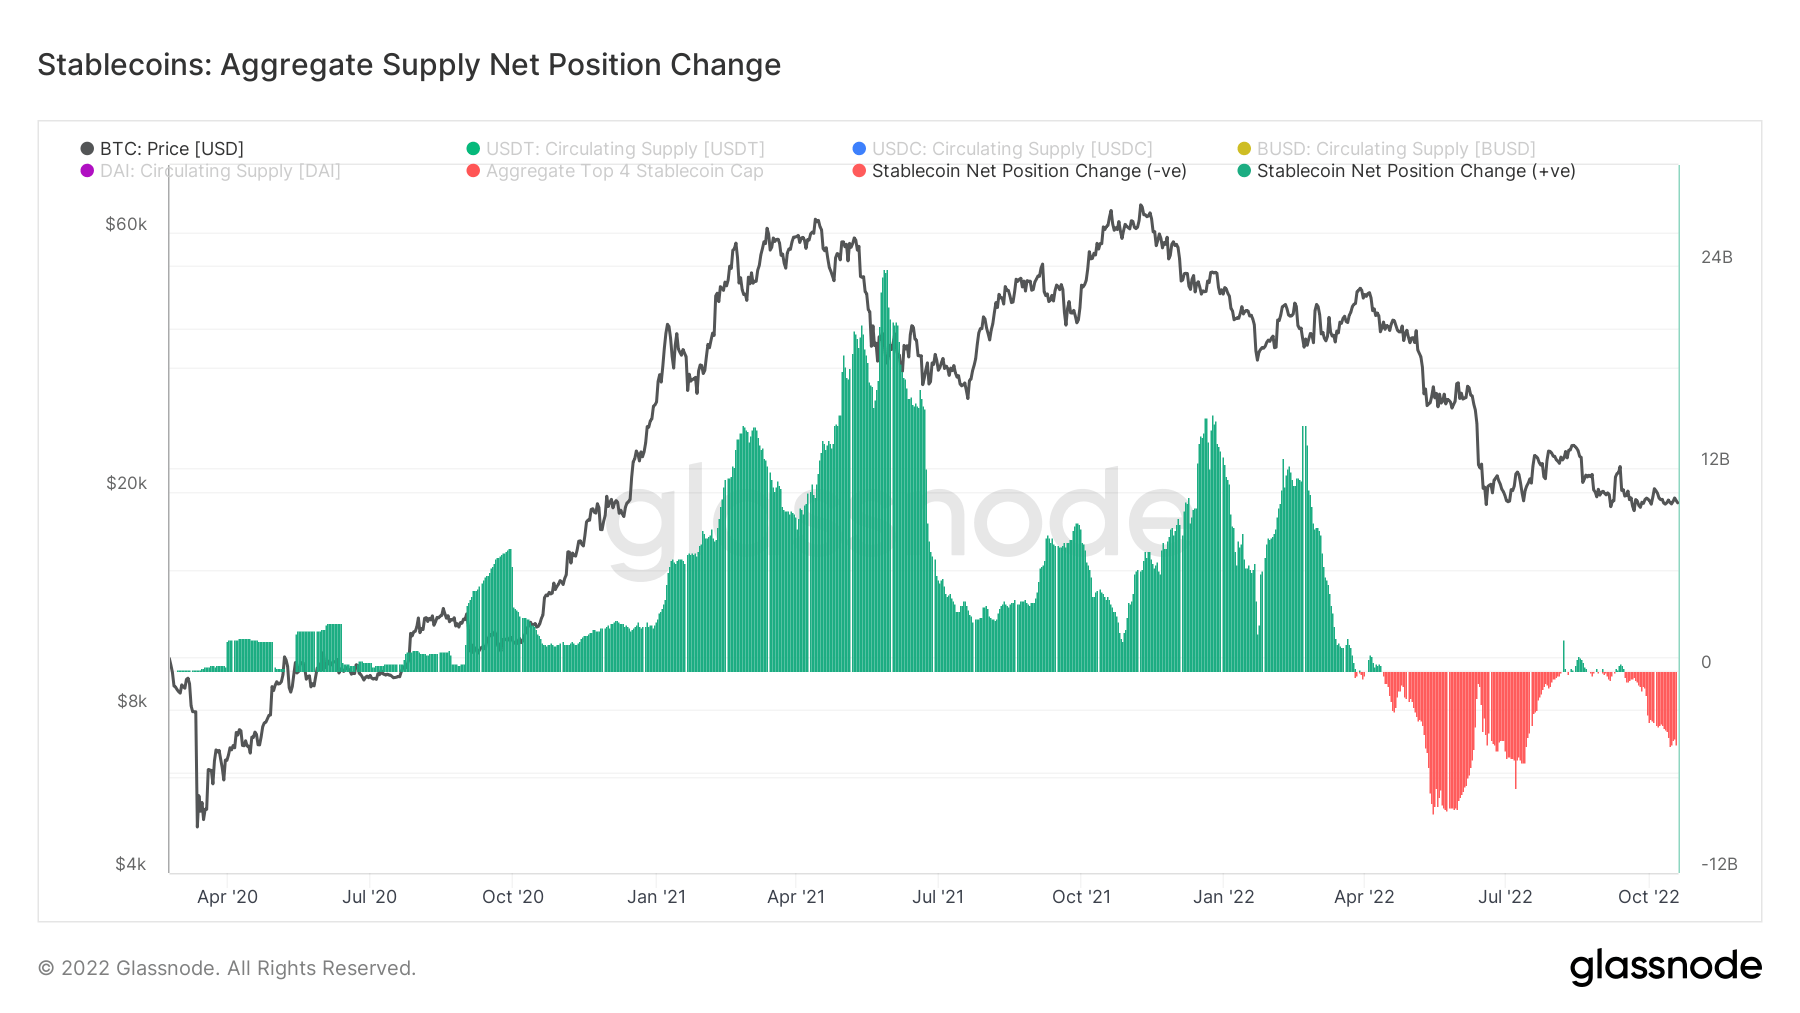
Change of regime for stablecoins
2021 was a monumental year for stablecoins, and going into 2022, the market cap of just the top 4 stablecoins alone was upwards of over $160 billion. Quite evidently, 2021 was a bubble propped up by futures and unsustainable yields. During the bull run of 2021, almost $24 billion of stablecoins were being put onto exchanges and most likely used in defi.
However, since the luna collapse, with Bitcoin dropping from $40k to $20k, distribution has been the central regime of stablecoins, at its peak of $12 billion of sell pressure. In a global deleveraging event in the macro world, selling occurs from stablecoins to fiat to make debt obligations; expect this regime to continue.
Source: https://cryptoslate.com/market-reports/weekly-macroslate-which-part-of-the-big-short-film-are-we-in-right-now-as-u-s-treasury-yields-continue-to-climb-and-invert-across-the-yield-curve/