„Bitcoin“ kainos prognozavimas - gegužės 24 d
After featuring a rebound that emanated during the last recently aggressive downing motions that went through the $27,500 support line, the BTC/USD market now moves in a range over the value line. The market has witnessed a high and a low of $29,644 and $28,663, keeping a minimum positive percentage of 0.91.
Bitcoin (BTC) statistika:
BTC kaina dabar – 29,482.49 XNUMX USD
BTC rinkos viršutinė riba – 560.9 mlrd
BTC cirkuliacinis tiekimas – 19.1 mln
BTC bendra pasiūla – 19.1 mln
Coinmarketcap reitingas – #1
BTC / USD rinka
Pagrindiniai lygiai:
Pasipriešinimo lygis: 32,500 USD, 35,000 USD, 37,500 USD
Palaikymo lygis: 27,500 USD, 25,000 USD, 22,500 USD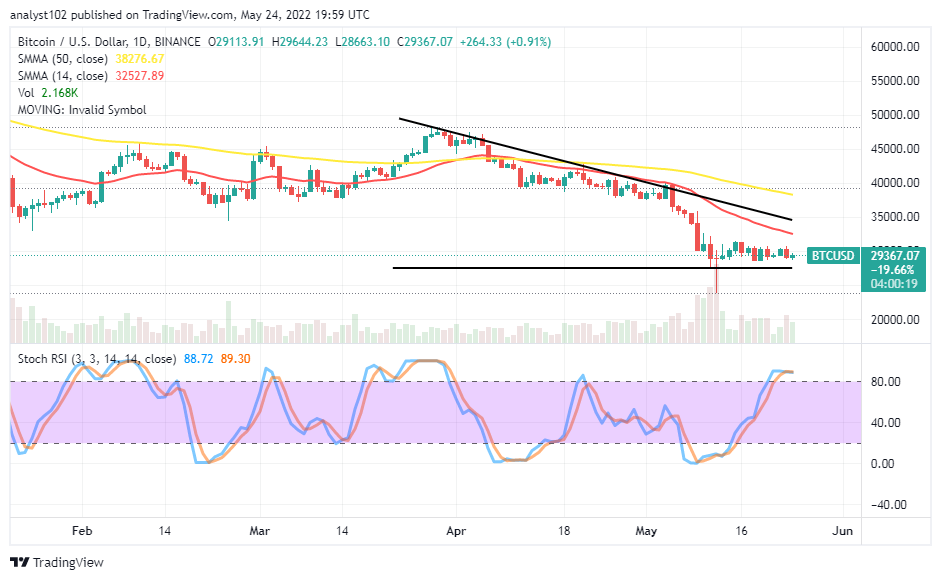
BTC / USD - dienos diagrama
The daily chart reveals the BTC/USD market moves in a range that features the $32,500 resistance as the upper range line and the $27,500 support as the lower range line. The 14-day SMA trend line positions below the 50-day SMA trend line. Different sizes of Japanese trading candlesticks have formed closely over the support level to attest to the current raging move. The Stochastic Oscillators are in the overbought region. And they have clogged the lines, validating that the market presently moves in a range.
Can traders rely on the reading of the Stochastic Oscillators to determine the next BTC/USD price direction?
The Stochastic Oscillators are one of the best trading tools to weigh the pace at which a pairing trading instrument is pushing at a point in time. Based on that, it would be to the advantage of traders to learn how to use them in decision-making. As the current situation suggests, the BTC/USD market moves in a range as an overbought condition has been depicted from the reading of the trading tool, indicating that the subsequent market actions maybe not favor the upside direction from the current capacity line afterward.
On the downside of the technical analysis, a false hike of the market needed to occur against a resistant trading spot around the $32,500 level before short-position takers can ride back on a downward-returning trend. The inability of price to break northward past the 14-day SMA will potentially give birth to early sell order. Therefore, short-position players needed to be on alert to avoid late entry.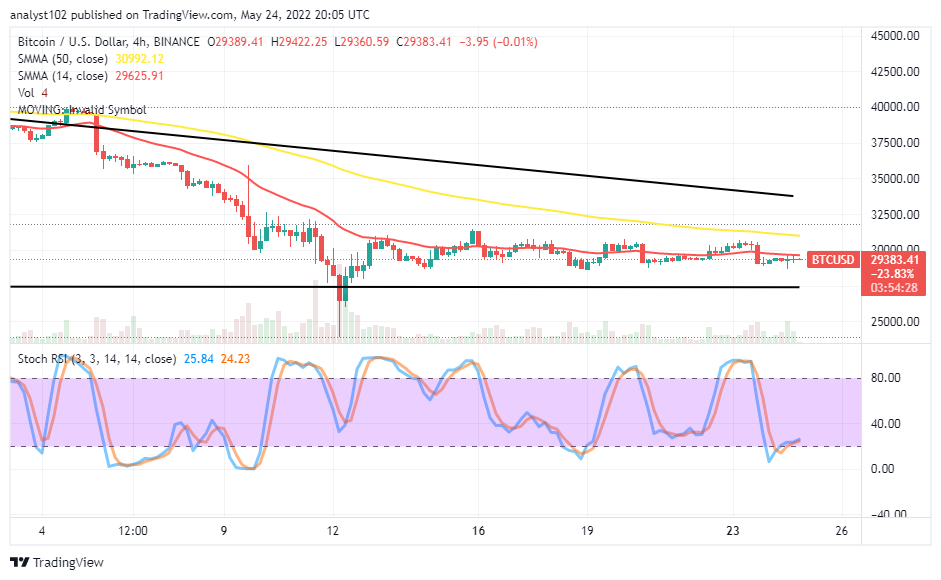
BTC / USD 4 valandų diagrama
Šios BTC / USD medium-term showcases the BTC market moves in a range against the US Dollar. The 14-day SMA trend line moves flatly to point in the east direction as candlesticks of different sizes are occurring around it underneath the 50-day SMA trend line. The horizontal line is at the $27,500 support level, serving as the pivotal baseline to expect featuring upspring Stochastic Oscillators are down, around the range of 20. And they are trying to consolidate around the value range line, confirming the market is going through a firm-ranging motion.
Norite dabar pirkti ar prekiauti „Bitcoin“ (BTC)? Investuokite į „eToro“!

68% mažmeninių investuotojų sąskaitų praranda pinigus, kai prekiauja CFD su šiuo teikėju.
Plačiau paskaitykite čia:
Source: https://insidebitcoins.com/news/bitcoin-price-prediction-for-today-may-24-btc-moves-in-a-range