RVN and ATOM have continued their positive moves in the uptrend zones, but the price movement has stalled as the market has reached the overbought area. HNT, APE and SOL are in a downward correction as cryptocurrencies continue to hold their critical support levels.
Ravencoin
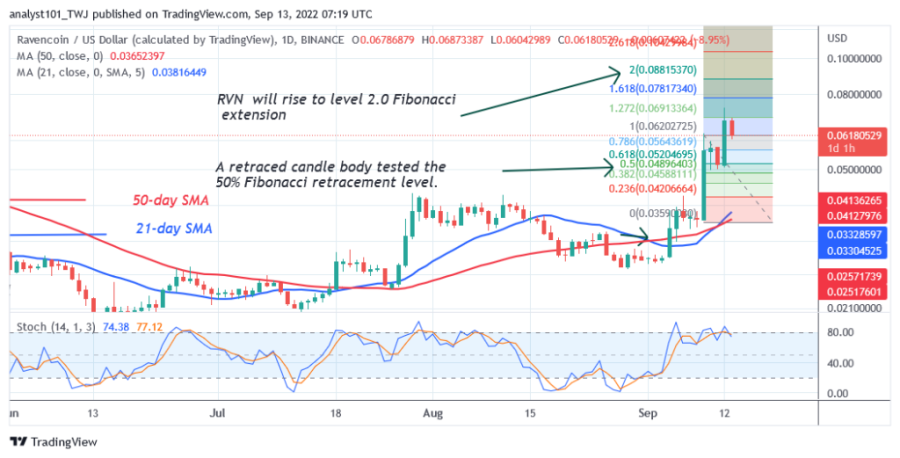
The price of Ravencoin (RVN) is in an uptrend. The cryptocurrency’s price is recording a series of higher highs and higher lows. The cryptocurrency value is likely to continue its upward climb. Further upward movement of RVN is doubtful as the market is approaching the overbought zone. The September 9 uptrend has seen a retraced candlestick testing the 50% Fibonacci retracement level. The retracement suggests that the altcoin will rise to the 2.0 Fibonacci Extension level or $0.088.
Meanwhile, RVN is above the 80% area of the daily stochastic. This indicates that the market has reached the overbought area. Further upward movement is doubtful. Altcoin is the best performing cryptocurrency asset this week. It has the following characteristics:
Kaina: $0.06102
Rinkos kapitalizacija: $1,281,523,115
Prekybos apimtis: $498,250,585
7 dienų pelnas: 64.58%
Helis
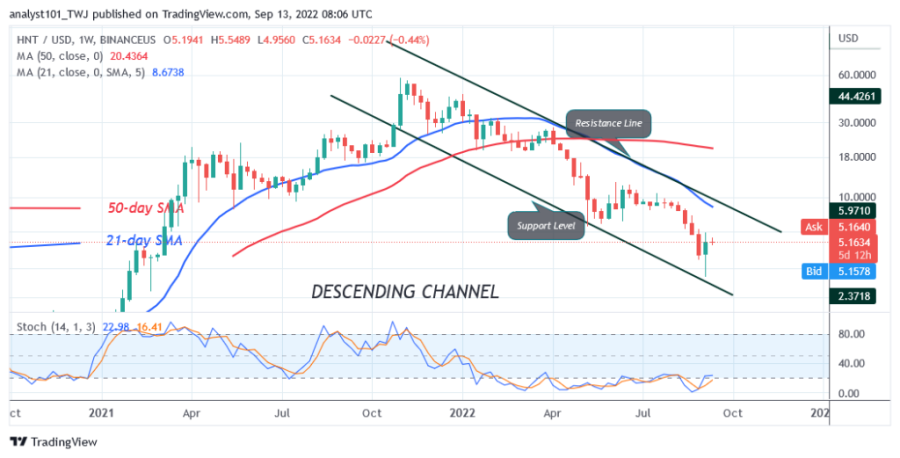
Helium (HNT) is in a downtrend as the altcoin drops to a low of $3.98. The cryptocurrency has previously dropped significantly from its high of $60. The downtrend has weakened since August 29, when the market fell back into oversold territory. HNT is in an upward correction, reaching the high of $5.97.
The altcoin is below the 20% area of the daily stochastic. This means that HNT has fallen into the oversold area of the market. The current downturn has reached its bearish exhaustion. It is likely that buyers will emerge to push prices higher. HNT is the cryptocurrency with the second best performance this week. It has the following characteristics:
Kaina: $5.17
Rinkos kapitalizacija: $1,152,575,413
Prekybos apimtis: $31,384,504
7 dienų pelnas: 35.46%
Kosmosas
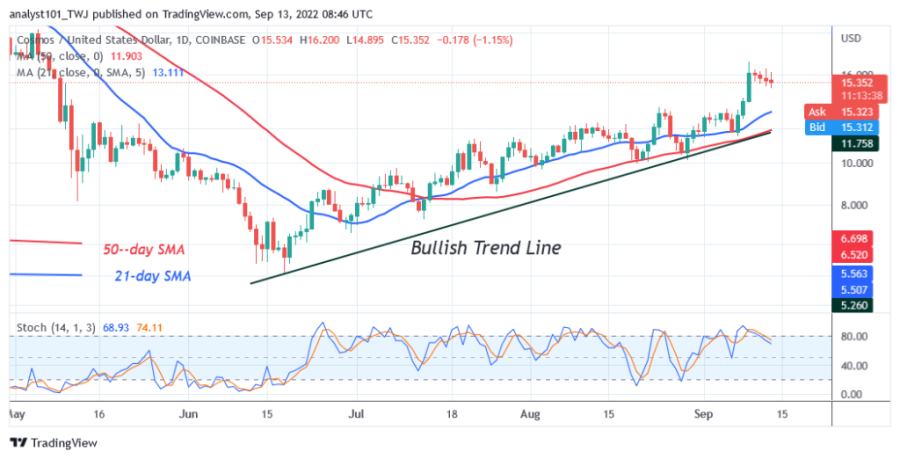
The Cosmos (ATOM) price is in an uptrend and the crypto price is making a series of higher highs and higher lows. On September 9, the price of ATOM reached a high of $17.10. Today, the altcoin is still recording a higher low on the downside. It is trading in the overbought zone as the cryptocurrency value has risen to the high of $17. The uptrend will resume if the price goes back above the moving average lines. The current uptrend could end if the bears break below the moving average lines or the uptrend line.
The daily stochastic is below the 80% area. It indicates that the market has reached the overbought region. ATOM is in a minor retracement. Sellers will appear in the overbought region and push the prices down. ATOM is the cryptocurrency with the third best performance this week. It has the following characteristics:
Kaina: $15.26
Rinkos kapitalizacija: $4,369,328,872
Prekybos apimtis: $558,229,782
7 dienų pelnas: 25.96%
ApeCoin
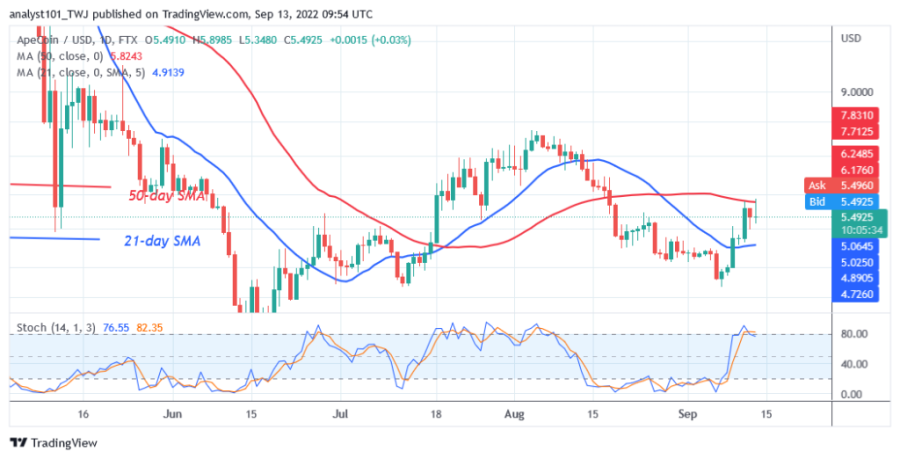
The price of ApeCoin (APE) is in a downward correction, but is trading between the moving average lines. The price of the cryptocurrency fluctuates between the moving average lines. The altcoin will develop a trend when the moving average lines are broken. On the upside, APE will rise to $7.71 if the price rises above the 50-day line SMA. This could also signal the resumption of the uptrend. However, the altcoin will resume its downward correction if the bears break below the 21-day line SMA.
ApeCoin is below the 80% range of the daily stochastic. The altcoin has reached the overbought region of the market. Sellers will appear in the overbought region and push the prices down. It has the following characteristics:
Kaina: $5.52
Rinkos kapitalizacija: $5,518,397,596
Prekybos apimtis: $462,368,966
7 dienų pelnas: 20.82%
J. Solana
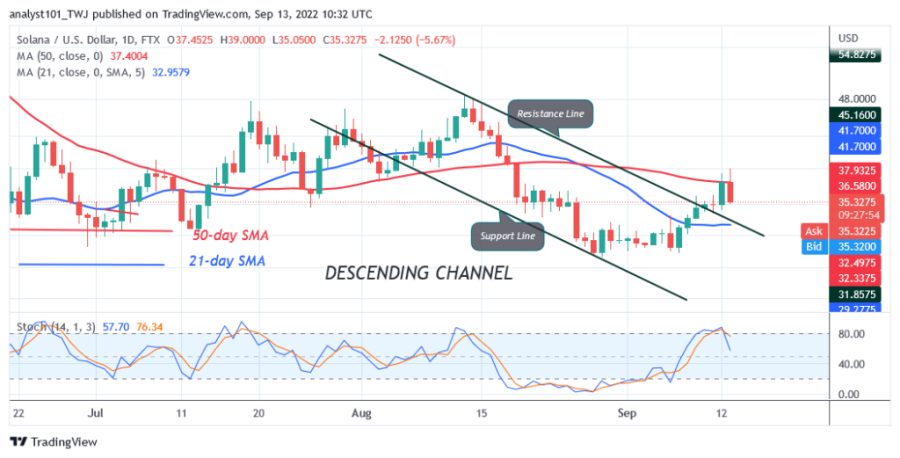
The price of Solana (SOL) is in a downward correction as the altcoin fluctuates between moving average lines. On September 12, the upward correction was stopped at the 50-day line SMA. If the price breaks above the moving average line, the altcoin will rise and retest the upper resistance of $48. The upper resistance has not been broken yet as SOL continues to trade in the overbought zone of the market. In the meantime, Solana will develop a trend if the moving average lines are broken.
The cryptocurrency is below the 80% area of the daily stochastic. The altcoin is in a bearish momentum. If the bears break the 21-day line SMA, the market will fall back to the previous low of $30. It is the cryptocurrency asset with the fifth best performance this week. It has the following characteristics:
Kaina: $34.74
Rinkos kapitalizacija: $17,867,112,045
Prekybos apimtis: $1,693,048,991
7 dienų pelnas: 15.71%
Atsakomybės apribojimas. Ši analizė ir prognozė yra asmeninės autoriaus nuomonės ir nėra rekomendacija pirkti ar parduoti kriptovaliutą ir neturėtų būti vertinama kaip „CoinIdol“ pritarimas. Prieš investuodami, skaitytojai turėtų patys atlikti tyrimus.
Source: https://coinidol.com/analysis-altcoins-upward-moves/

