Šios TRON (TRX) price has reached a crucial confluence of long-term resistance levels. Whether it breaks out or gets rejected will likely determine the future trend’s direction.
There was some positive and negative TRON news last week. On the positive side, the TRON blockchain viršijo Binance chain and became the second-largest blockchain based on total value locked (TVL).
In negative TRON news, Justin Sun, the founder of the TRON foundation and network, stated that his Huobi exchange would atleisti around 20% of its workforce. Moreover, he withdrew 100 milijonų JAV dolerių in stablecoins from Binance and deposited them into Huobi, possibly to assist with the increased withdrawals.
Despite this mixed news, the TRON price performed admirably last week and saved a potential breakdown.
TRON Price Reaches Crucial Resistance
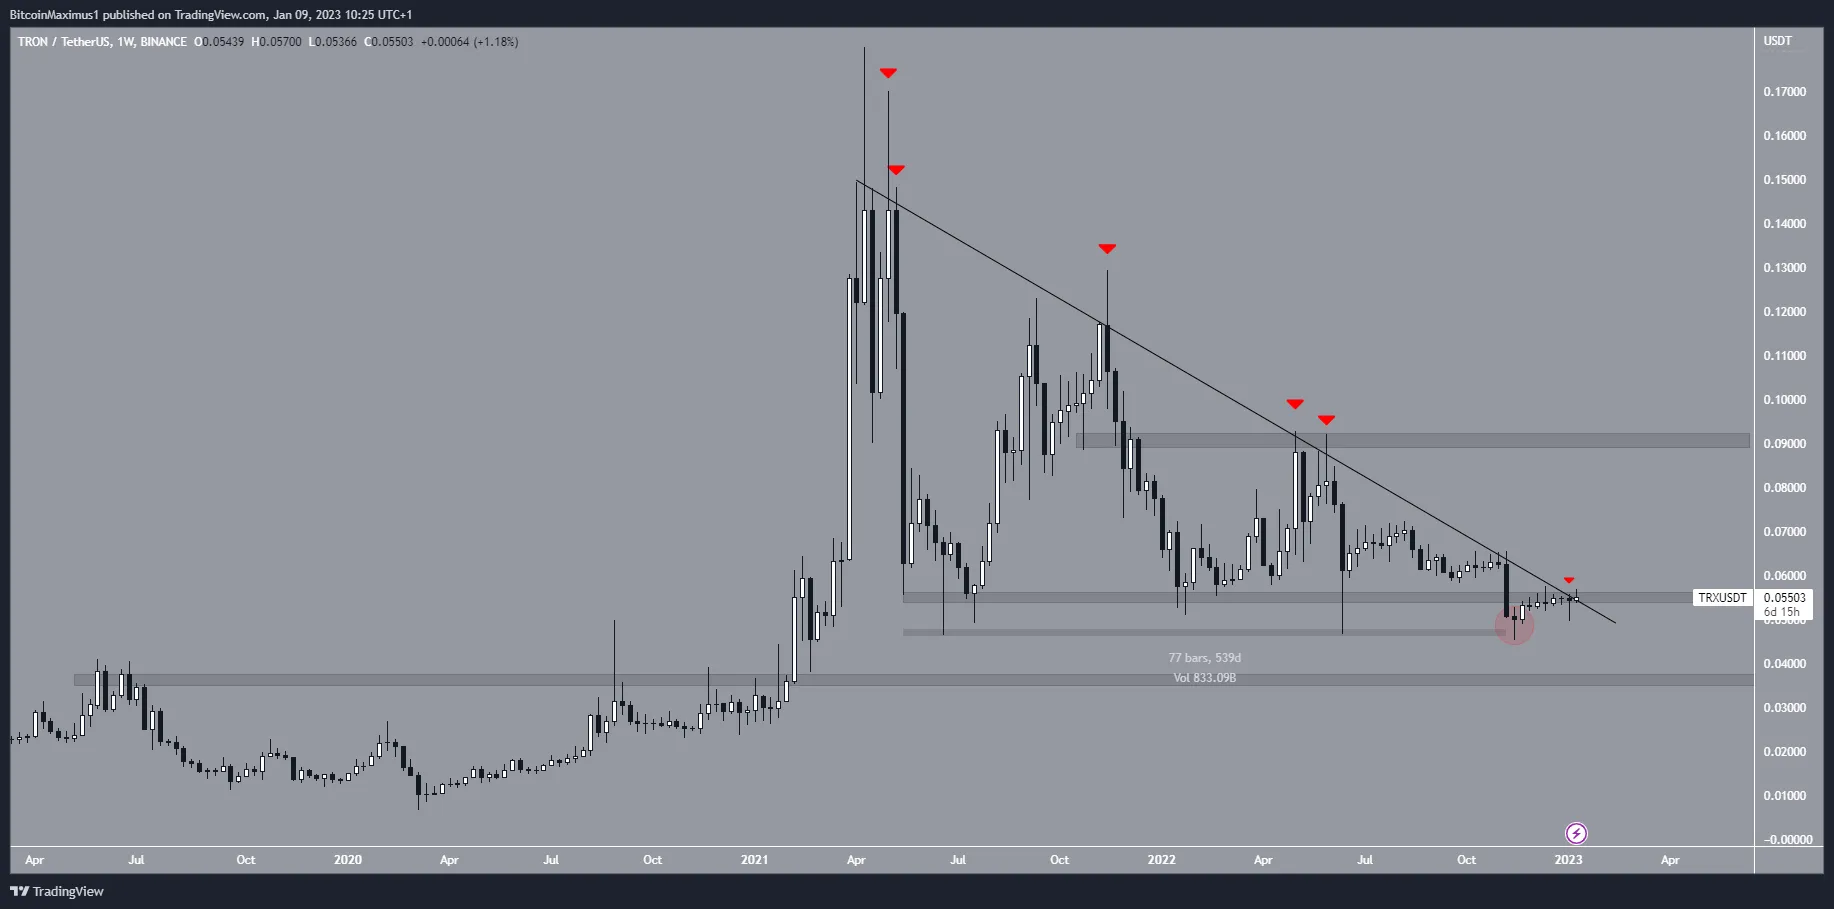
The TRON kaina has fallen below a descending resistance line since its 2021 high of $0.18 in April. This led to a minimum price of $0.045 on Nov. 14.
During the period, the most critical price action occurred in Nov. 2022. At the time, it seemed that the TRX price broke down (red circle) from the $0.055 horizontal support area, which had been in place for 540 days.
However, the ensuing upward movement suggests that the decrease was a deviation. Currently, the TRON price is attempting to break out from both the $0.055 horizontal resistance area and the descending resistance line.
If it is successful in doing so, it would confirm that the breakdown was not legitimate, and a sharp upward movement could follow. In this case, the TRON price prediction for Jan. and beyond would be bullish, leading to an increase to the next resistance at $0.09.
On the other hand, a rejection could lead to a sharp fall toward the next support area at $0.036.
TRON Price Prediction For Jan: Will Trend be Bullish?
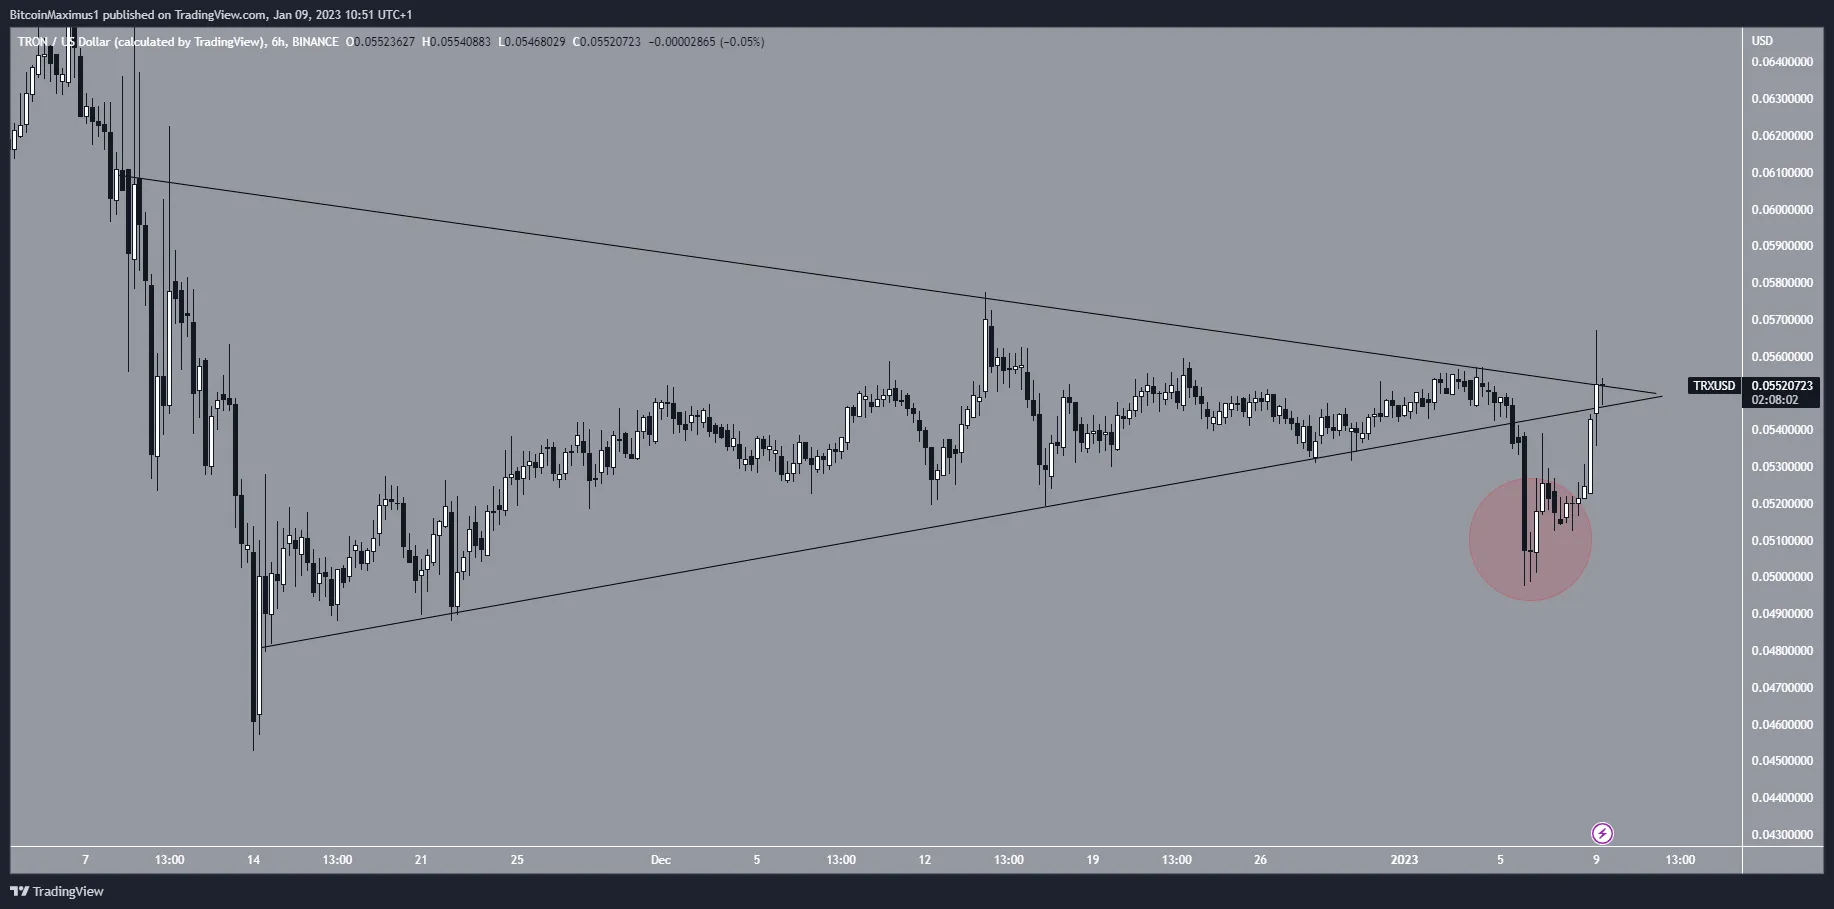
The technical analysis from the six-hour time frame is leaning toward a successful breakout. The main reason for this is that on Jan. 5, the TRX price seemingly broke down from a symmetrical triangle (red circle). However, it reclaimed the triangle’s support line during the next 24 hours and is now attempting to break out.
A significant movement often follows failed breakdowns or breakouts in the other direction. As a result, a breakout from the triangle would also mean that the TRX price will break out from the $0.055 resistance area.
On the other hand, failed to break out could take the TRON price back below $0.055.
To conclude, the TRX price analysis is leaning bullish, due to the failed breakdown in the short-term and potentially failed breakdown in the long-term. A weekly close above $0.055 would confirm the long-term reversal, while a rejection from the area would indicate that the trend is still bearish.
Dėl naujausios BeInCrypto kriptovaliutų rinkos analizės, spauskite čia.
Atsakomybės neigimas
BeInCrypto stengiasi pateikti tikslią ir naujausią informaciją, tačiau ji nebus atsakinga už trūkstamus faktus ar netikslią informaciją. Jūs laikotės ir suprantate, kad bet kokią šią informaciją turėtumėte naudoti savo rizika. Kriptovaliutos yra labai nepastovus finansinis turtas, todėl tyrinėkite ir priimkite savo finansinius sprendimus.
Source: https://beincrypto.com/tron-price-prediction-jan-bullish-month-ahead/